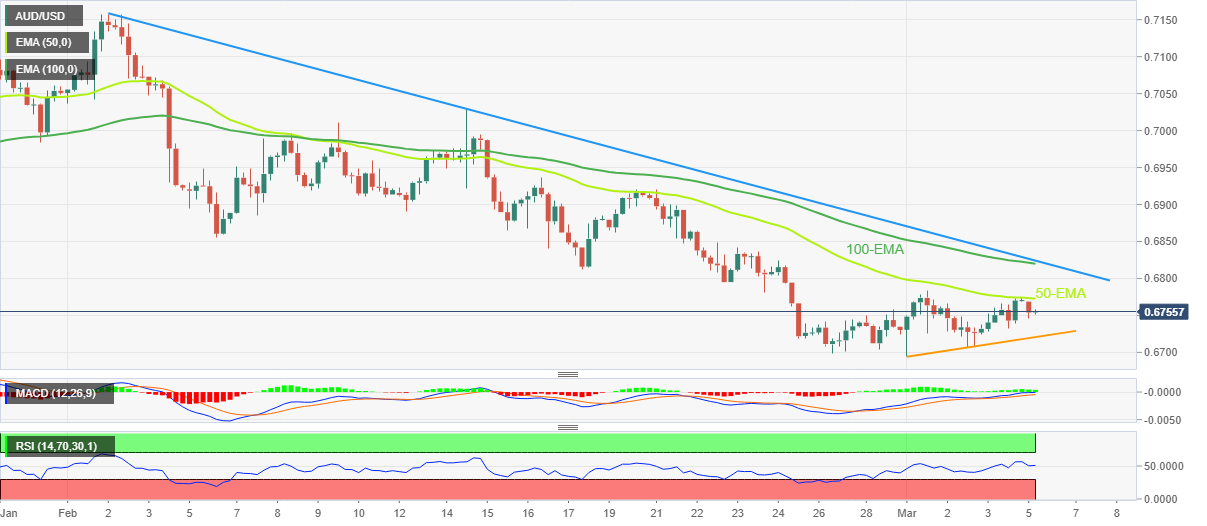
- AUD/USD pares the first weekly gain in three around the lowest levels in two months.
- Convergence of 100-EMA, one-month-old descending resistance line adds to the upside filters.
- Bullish MACD signals, RSI’s upward grind keeps pair buyers hopeful.
- Downside break of ascending support line from Wednesday appears crucial for bear’s return.
AUD/USD prints mild losses around the mid-0.6700s as bulls take a breather following the first weekly gain in three during early Monday. In doing so, the Aussie pair portrays the failure to cross the 50-bar Exponential Moving Average (EMA).
Even so, the bullish MACD signals and the RSI (14) rebound keeps the AUD/USD buyers hopeful unless the quote breaks a three-day-old support line, around 0.6720.
Following that, the monthly low near the 0.6700 round figure and the January 2023 low of 0.6687 can act as extra checks for the Aussie pair sellers before giving them control.
Should the AUD/USD bears keep the reins past 0.6687, the last December’s bottom surrounding 0.6630 may gain the market’s attention.
On the contrary, recovery moves need to cross the 50-EMA hurdle near 0.6775 to convince intraday buyers of the AUD/UDS pair.
However, a convergence of the 100-EMA and a downward-sloping resistance line from early February, around 0.6820-25 by the press time, appears a tough nut to crack for the pair buyers.
In a case where the AUD/USD bulls manage to keep the driver’s seat past 0.6825, the odds of witnessing a run-up toward the mid-February high of near 0.7030 can’t be ruled out. It should be noted that the 0.7000 round figure may act as a buffer between 0.6825 and 0.7030.
AUD/USD: Daily chart
Trend: Limited downside expected

