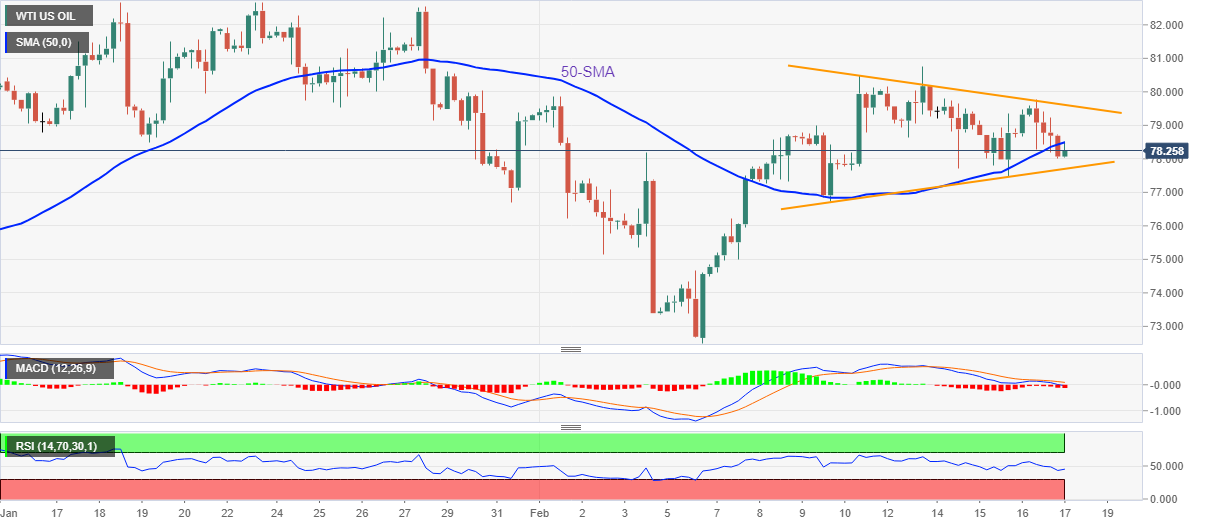
- WTI picks up bids to snap four-day downtrend, stays within one-week-old symmetrical triangle.
- 50-SMA, bearish MACD signals probe buyers, steady RSI line suggests further grinding of Oil price.
- Weekly high near $80.75 appers the last defense of Oil sellers.
WTI crude oil licks its wounds around $78.30 during early Friday morning in Europe. In doing so, the black gold prices pare the weekly loss while positing the first daily gains in five while staying inside a one-week-old symmetrical triangle formation.
That said, the quote’s latest rebound pokes the 50-SMA hurdle surrounding $78.50. Also challenging the Oil buyers are the bearish MACD signals.
It’s worth noting, however, that the stated symmetrical triangle limited the energy benchmark’s short-term moves between $79.60 and $77.70 by the press time.
Should the commodity prices rally beyond $79.60, the $80.00 round figure and the weekly top of $80.75 could act as additional upside filters for the WTI bulls to watch.
On the contrary, a downside break of the stated triangle’s lower line, close to $77.70 at the latest, could trigger a fresh fall in the Oil price.
In that case, $76.70 holds the key to the commodity’s downside towards the previous weekly low surrounding $72.50.
If at all the WTI crude oil bears keep the reins past $72.50, January’s bottom of $70.27 and the $70.00 round figure should act as the final stops for the buyers before leaving the train.
WTI: Four-hour chart
Trend: Further downside expected

