The US major indices are closing higher. For the NASDAQ, it is the fifth consecutive up day. For the S&P and the Dow each have gained over the last three trading days and are up four of five days.
Both the Dow Industrial Average and the NASDAQ index rose by 0.64% today. The S&P was up 0.34%.
Of the 11 sectors of the S&P index three or lower while eight moved higher. The decliners today included:
- Consumer Staples, -0.79%
- Utilities -0.64%
- Healthcare -0.39%
The biggest gainers today included:
- Energy +1.87%
- Real estate +1.09%
- Communication services +0.8%
- Information technology +0.72%
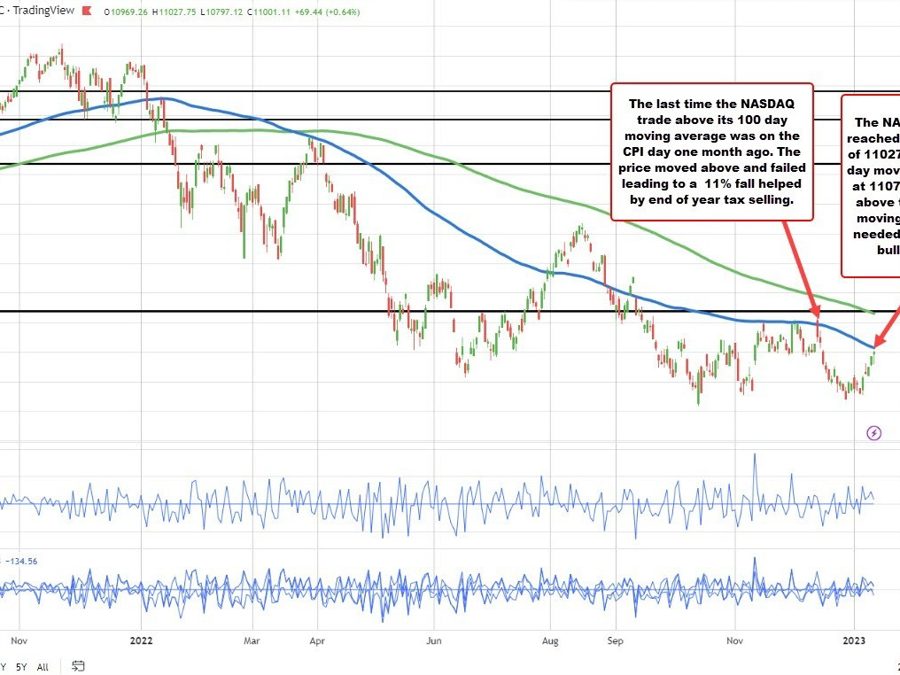
Looking at the NASDAQ index on the daily chart below, the price is getting closer to its 100 day moving average at f 11070.80.
Back on the last CPI day in December, the price gapped above the 100 day moving average, only to fail on the same day . That led to a -11.79% decline helped by end of year tax selling.
This year, the index is been stepping back higher.
The 100 day moving average level is also lower (it was at 11464 back on December 13. It is currently at 11070.80), making it an easier hurdle to get to and through. If the MA is broken, traders with look toward the December high near 11571 followed by the falling 200 day moving average at 11651.70 as the next upside targets on the daily chart.
The NASDAQ index has not traded above its 200 day moving average (green line in the chart below) since January 14, 2022 when the moving average was way up at 14726.49.
Sellers dominated in 2022. Will they have their day (or at least see a modest corrective move higher) in 2023? So far, the index is off to a good start.
