Yesterday, the USDCAD moved sharply lower despite the fact that oil prices were tumbling to the downside. Below is the post on the pair. Here is the link: https://www.forexlive.com/technical-analysis/oil-is-down-350-but-usdcad-is-lower-by-134-20230104/
Maybe the move to the downside (higher CAD ) was off the AUD strength. Remember it moved higher on the fundamental story that China would look to import more coal. Rise from the association of being a commodity currency.
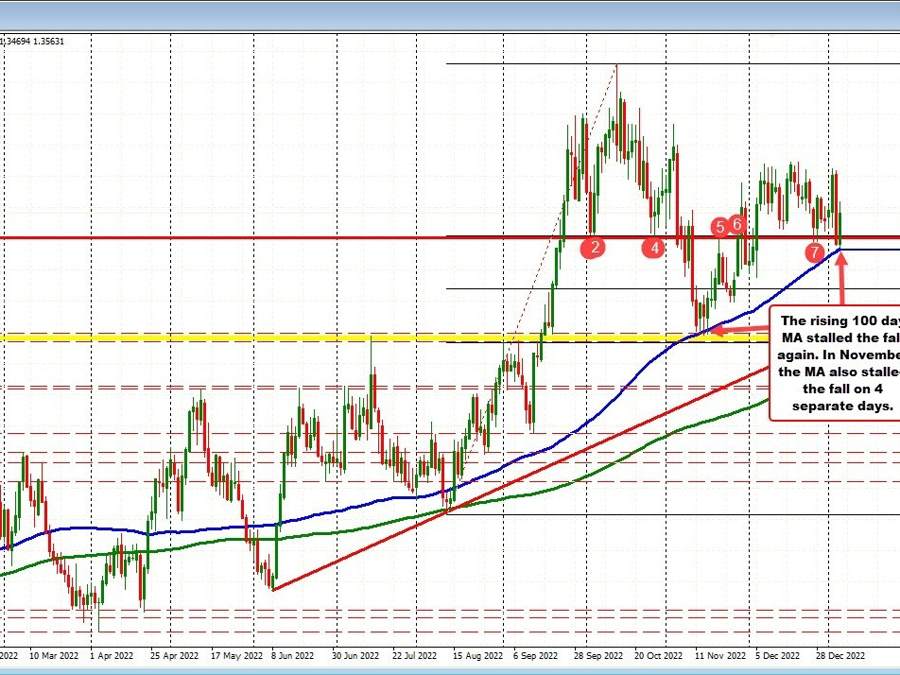
What we know today, is the price stretched down in the first hours of trading in the Asian session, reached to 1.3469, which was within 7-8 pips of the 100 day MA, and the buyers said “that was enough”.
The price started to move back to the upside.
Looking at the daily chart below, back in November, with the price coming off the October high, the price also tested the 100 day MA over 4 consecutive days. ON two of those days, the price moved below but quickly reversed higher.
The 100 day MA on the USDCAD held support again today
What now?
Looking at the hourly chart, the rebound off of the 100 day MA took the price back above the 100/200 hour MAs (blue and green lines on the chart below), that is near the middle of the up and down trading range since the start of the December. Those MAs are near converged at 1.3563. The price is trading at 1.3572, after the dip took the price to 1.35465.
The 100/200 hour MAs are now the close barometer for bullish and bearish. The buyers have the edge now with the price above the MA levels. The sellers did try to wrestle back control but they failed on the last dip. Traders looking for more upside will now want to see that level not only hold, but for the price to move higher and away.
USDCAD 100/200 Hour MAs are now the mid range barometer
