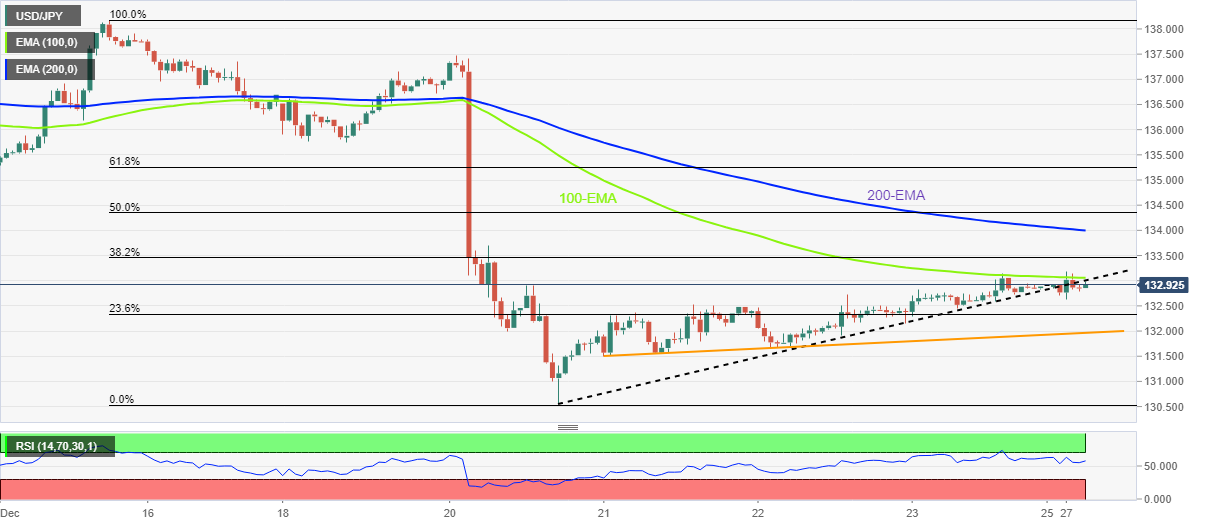
- USD/JPY retreats from one-week high to snap three-day uptrend.
- Downside break of weekly support line adds strength to bearish bias.
- 100, 200 EMAs add to the upside filters.
USD/JPY remains depressed around 132.90 as it prints the first daily loss in four during early Tuesday morning in Europe. In doing so, the Yen pair justifies the downside break of a one-wee-old ascending trend line, as well as a U-turn from the 100-hour Exponential Moving Average (EMA).
The pullback move also takes clues from the RSI (14) retreat, as well as an absence of the oversold RSI line.
That said, the USD/JPY price aim for the 23.6% Fibonacci retracement level of December 15-20 downside, near 132.30.
Following that, an upward-sloping support line from the last Wednesday, near the 132.00 round figure could test the USD/JPY bears before directing them to the recently flashed multi-month low near 130.60.
In a case where the USD/JPY pair drops below 130.60, the August 2022 low near 130.40 and the 130.00 psychological magnet could act as the last defense of the buyers.
Alternatively, the support-turned-resistance line and the 100-EMA, respectively around 132.95 and 133.05, could restrict immediate USD/JPY recovery before highlighting the 200-EMA level of 134.00.
Should the USD/JPY bulls keep the reins past 134.00, the December 19 swing low near 135.80 will gain the market’s attention.
It should be noted that the 50% and 61.8% Fibonacci retracement levels, respectively near 134.35 and 135.25, could probe the USD/JPY bulls during the expected rise.
USD/JPY: Hourly chart
Trend: Further downside expected

