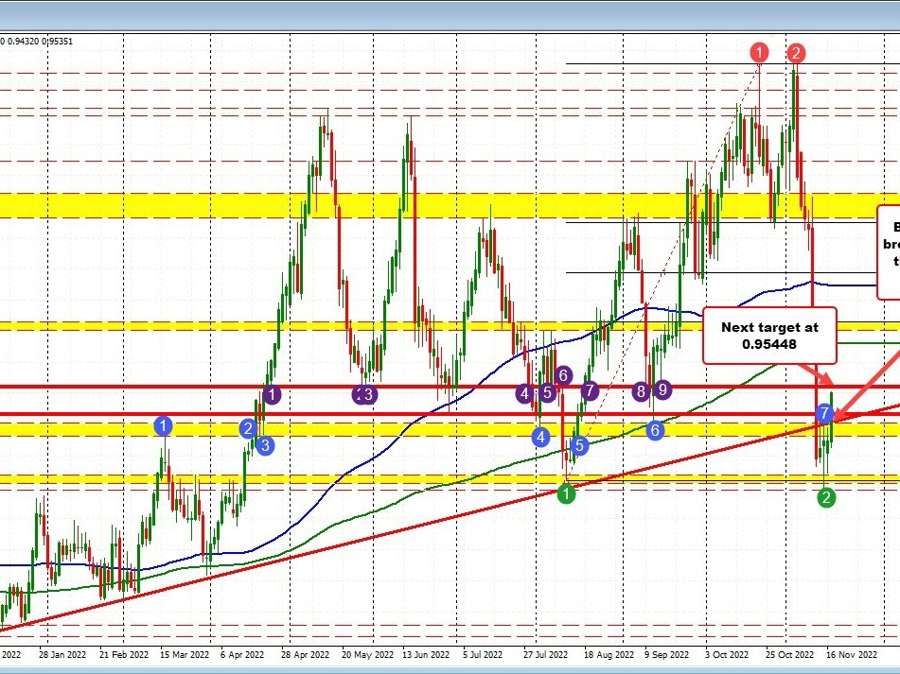
USDCHF snaps back higher
The USDCHF has seen a sharp fall in the month of November after initially moving higher over the first 2 trading days of the month, only to find sellers leaning against the October high at the 1.01471 level.
The next 8 days saw the price retrace the entire move up from the August low to the October/November highs (from the red circle 2 to the green circle 2 in the chart above). The low price in August reached 0.9370. The low price – reached on Tuesday – extended just below that level to 0.9353 before bottoming and rotating higher today.
The USDCHF has been prone to sharp moves higher and lower this year as evident from the price action on the above daily chart . The move today has taken the price back above a broken trend line and a swing area between 0.9453 and 0.9479. The broken trend line cuts across at 0.9479.
On the topside, the next target comes in at 0.95449 where there are also a number of swing levels going back to the end of April. Get above it, and I cannot rule out more upside momentum. This pair has a history of quick moves and the bounce is still relatively modest.
