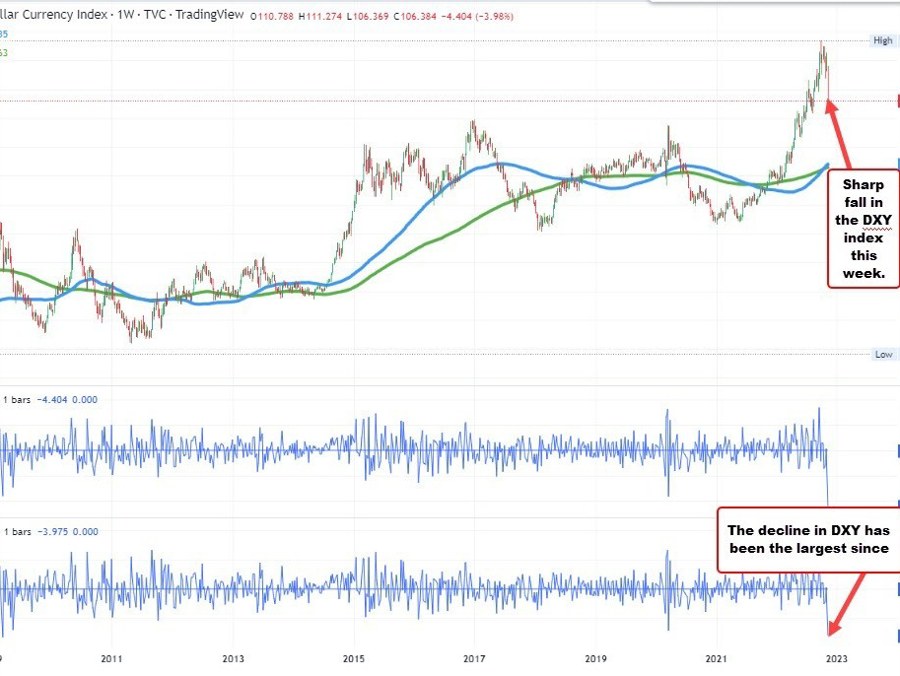
The dollar index (DXY) is trading to a new low for the week at 106.369. The index is currently down -440 pips this week and is down -3.97%. That is the largest decline since March 2009 when the index fell around 4.10% on the week.
The weekly chart below shows the pip change in the top chart on the bottom. The lowest chart shows the % change for the week going back in time. That decline shows a fall of -3.97%
Dollar index is down the most since March 2009
Drilling to the daily chart below, the DXY fell below the 100 day MA yesterday at 109.056. The close below was the first since mid-June 2021. The next key target on the downside is the 38.2% of the move up from the January 2001 low which comes in at 105.01. The rising 200 day MA is at 104.782. That combination would give sellers cause for pause on a test going forward.
The DXY is below 100D MA for the first time since June 2021
Looking at the individual currency pairs:
- EURUSD is trading to a new high and tests a key swing area on the daily chart between 1.0348 and 1.03657 (see post here)
- GBPUSD is trading in a swing area on the weekly chart between 1.1759 it 1.1840 ding to a new high and tests (see post here)
- USJPY is trading to a new low. Today the price is below the 100 day moving average at 140.758, below the September 22 low at 140.308, and the July high at 139.318. The next target comes in at the 30.2% retracement of the 2022 trading range at 137.240 (see chart below)
USDJPY smashed through 100 day moving average today
- USDCAD is trading to a new low at 1.3248, and gets closer to its rising 100 day moving average at 1.3224 and its 38.2% retracement of the move up from the May 2021 at 1.3224 a swing area between 1.3207 and 1.3222 is just below that 100 day moving average/38.2% retracement level.
USDCAD falls toward 100 day MA/38.2% retracement target
