- Silver price fails to extend two-day uptrend, eases from intraday top of late.
- 50-HMA adds strength to the weekly triangle’s support.
- Hidden bearish RSI divergence teases XAG/USD sellers but break of $18.60 is necessary.
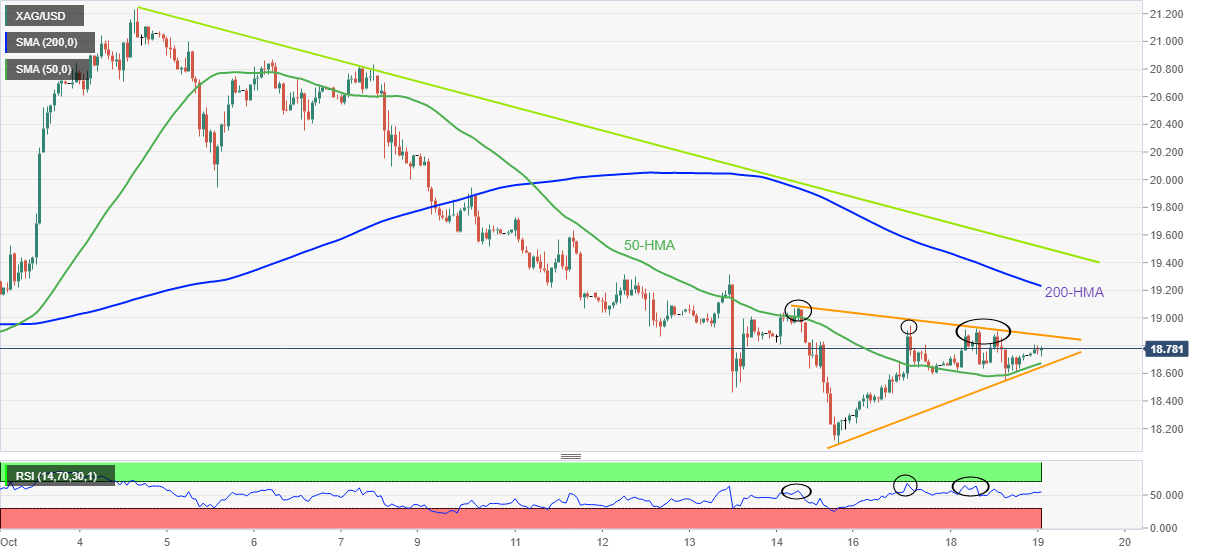
Silver price (XAG/USD) remains sidelined around $18.75-80, fading the two-day uptrend during Wednesday’s Asian session as the bright metal trades inside a weekly symmetrical triangle.
The bullion’s latest inaction could be linked to the mixed technical signals as the 50-HMA defends buyers but hidden bearish RSI divergence and the sustained trading below 200-HMA keeps the XAG/USD sellers hopeful. Also acting as an upside filter is the descending trend line from October 04, near $19.50 by the press time.
Hence, the commodity prices are likely to remain sideways unless breaking the aforementioned triangle, currently between $18.90 and $18.65. However, the odds favoring the downside are high.
That said, a clear downside break of $18.65 could quickly drag the XAG/USD price toward the monthly low of $18.08. Following that, the yearly low marked in September at around $17.55 will be in focus.
On the flip side, silver buyers’ dominance past $18.90 will need validation from the $19.00 threshold to aim for the 200-HMA level surrounding $19.25. Even so, the previously stated two-week-old resistance line will challenge the bulls around $19.50.
In a case where XAG/USD remains firmer past $19.50, the $20.00 psychological magnet and the monthly peak of $21.25 should gain the market’s attention.
Silver: Hourly chart
Trend: Further weakness expected

