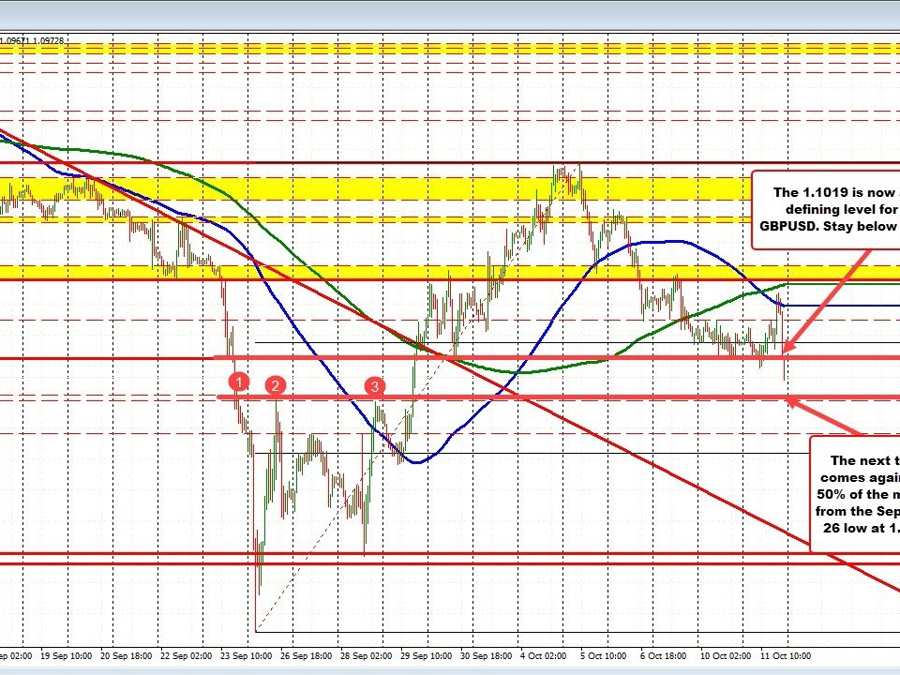
GBPUSD falls to a new session low
The BOE Bailey comments have helped to reverse the GBPUSD lower and the USD back to the upside. Just an hour or so ago, a number of major indices were testing their 100/ 200 hour MA levels on the USD selling (see video here). Those levels stalled the moves in EURUSD, GBPUSD, USDCHF, USDCAD and NZDUSD. The pairs are now welll off those level.
For the GBPUSD it is reaching to new session lows, just a couple hours after moving up to and through its 100 hour moving average (blue line in the chart above), but falling short of its higher 200 hour MA (green line in the chart above). Sellers leaned near the area, and the comments from Bailey are giving more of a shove to downside and to new session lows.
Looking at the hourly chart above, the price has also now move below the 1.1019 level (was a swing low from September 30 and again yesterday). Earlier today the price dipped below that level only to snap back to the upside.
The current prices trading at 1.0972. The 1.1019 level is now a risk defining level. Stay below is more bearish.The low reached 1.0963
On the downside, the 50% retracement of the move up from the September 26 low comes in at 1.0924 and is the next major target for the shorts. That level also corresponds with swing levels going back to the end of September (see red numbered circles on the chart above).
Other currency pairs are following suit.
- EURUSD : The EURUSD did not quite reach its 100 hour moving average at 0.9778 (the high price reached 0.9774), but is currently trading back down at 0.9696 and looks toward the New York session low at 0.96899. A move lower will look to enter a swing area between 0.9662 and 0.96836. The 0.9662 level was the low of a swing area going by all the way back to June to October 2002 between 0.9662 and 0.9708 (not shown).
EURUSD found sellers against the 100H MA
- USDJPY: The USDJPY is trading to a new session high and looks to test the high price from September at 145.90. The current prices trading at 145.88. Recall the Bank of Japan came in and intervened at that old high price. With the clock ticking toward the Asian session, traders might be a little bit hesitant to move higher despite the fact that the fundamentals certainly support buying the USD and selling the JPY.
USDJPY tests the high from September
- USDCHF: The USDCHF was an other pair that moved down to test its 100 hour moving average on the earlier dollar selling, but found support buyers against level (100 hour moving average is at 0.9922). The reversal higher in the dollar has the USDCHF now trading up at 0.99722 the parity level (the price just reached 0.99787). The parity level is the next upside target. Buyers are still in control.
USDCHF bounces off its 100 hour moving average
- USDCAD: The USDCAD also tested its 100 hour moving average on the USD selling just an hour of so ago at 1.3721. The current prices trading back above the 1.3800 level at 1.3809.
USDCAD bounces off its 100 hour moving average
US stocks also reversed lower.
- The S&P index is back below the 200 week moving average at 3600. Currently trades at 3578.74, down -34 points or -0.95%.
- The NASDAQ index is down -163 points or -1.54% at 10379.
- The Dow industrial average is trading above and below unchanged
