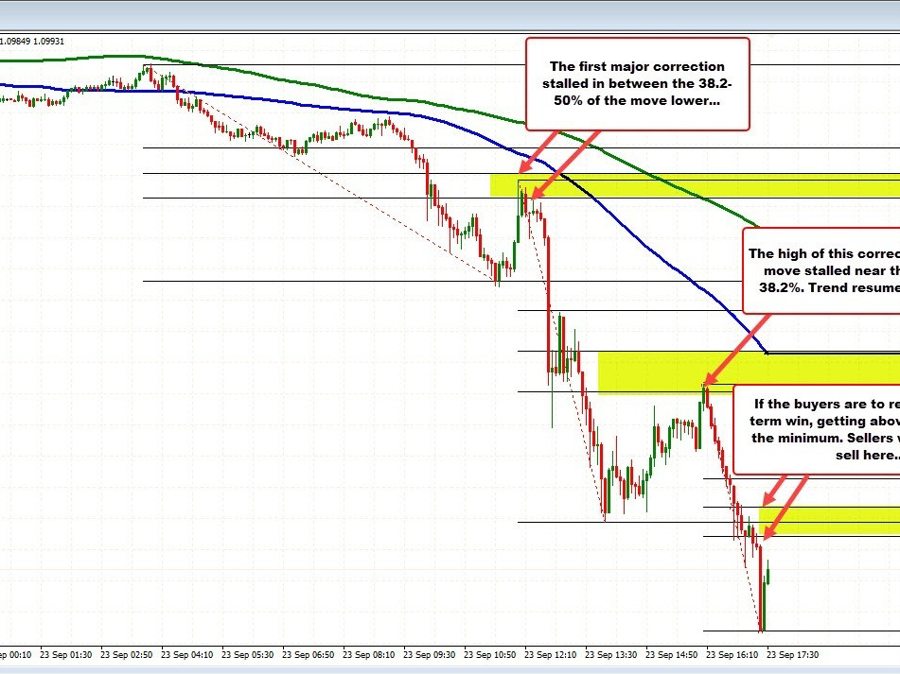
In the morning video, I discussed the trend move to the downside and earmarked the 38.2-50% of the “last trend leg lower” as the minimum target to get and stay above to tilt the intraday bias a little more to the upside. That was the minimum.
GBPUSD trends lower
The corrective move higher at the start of the NY session moved up to test the 38.2% at 1.10916 and backed off. The high reaches 1.10957. The last 80 or so minutes has seen another trend leg that saw the price move from 1.1095 to 1.0959. The 38.2-50% of that trend leg comes in at 1.1011 to 1.1027. Like the other trend leg, it will now take a move above that area to give the buyers some hope that the trend is over and that there could be more corrective action to the upside. That is the minimum. However, if it can be breached it would be a slowing of the trend.
See my analysis in the morning video starting at 5:34 in the morning video HERE
What about longer term?
Folks, the GBPUSD is trading at the lowest level since 1985. I was young in 1985, just getting started in my career.
Yes… the pair is oversold, but many traders have been saying that for a while. This may be a blow off. We are actually getting closer to parity, but in a trending market, it is more the job of the anti trend traders (i.e. the buyers) to prove they can take back control.
Looking at the daily chart below, are the buyers showing they are taking control for long on the chart above? I don’t see it.
GBPUSD on the daily chart
Looking at the hourly chart, I did speak in the morning video of the pair’s price moving back above the broken trend line, but warned that the dip buyers had to stay above that level and get above the retracement levels on the 5-minute chart to give the signal the low might be in place.
It did not do either of those things.
Looking back in time, the price corrective highs in the GBPUSD tested the 100 hour MA last week and this week and found sellers. The price has not been above that MA (blue line in the chart below) since September 13. The 100 hour MA is up at 1.1317.
GBPUSD on the hourly chart is bearish
The price is oversold, but the buyers still have to prove the bottom is in. That will start on the 5-minute chart and then it would have to stay above the aforementioned retracement level. Absent that, and the sellers are in firm control.
PS. As I type, the pair takes another move to below 1.0900 to 1.0897. Since the last corrective high at 1.1095 near the 38.2%, the price has trended close to 200 pips to 1.0897. Wow! The range for the day is now 377 pips. Sellers are still in control.
GBPUSD continues to trend
