This via the folks at eFX.
For bank trade ideas, check out eFX Plus. For a limited time, get a 7 day free trial, basic for $79 per month and premium at $109 per month. Get it here.
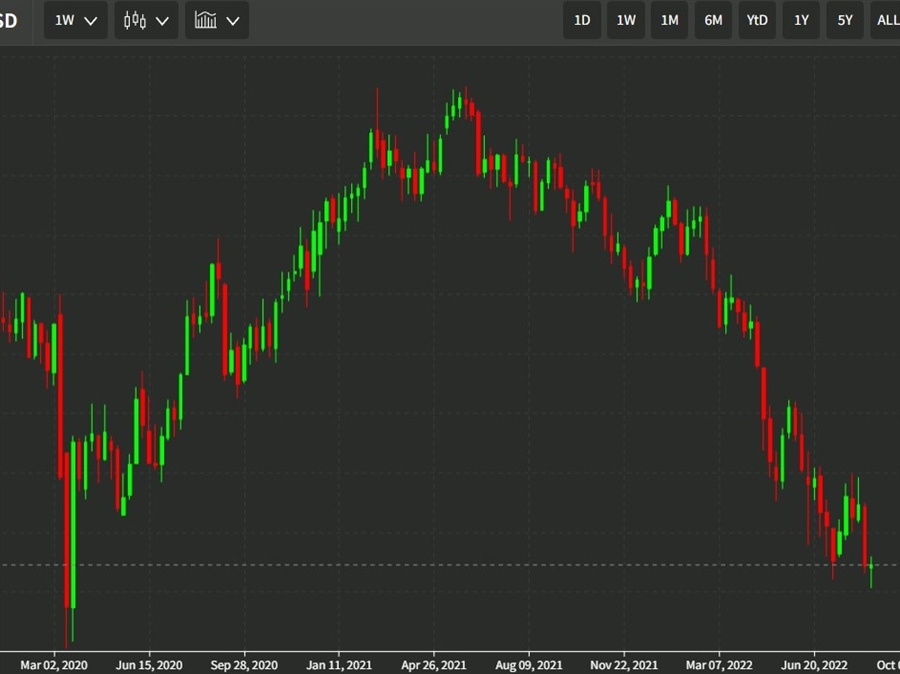
- “The long term GBPUSD chart now truly looks awful. One can view it as a major double top forming as a continuation that suggests a move to and possibly below parity. There is no material support now (outside of the March 2020 spike low just above 1.14) until the major lows posted in 1985 at 1.0520,” Citi notes.
“In addition, a close this month, if seen, below 1.1760 will be a bearish outside month as a continuation,” Citi adds.
Weekly cable chart, below.
(This chart is from our charting app, which is free and can be found at this link)
This article was originally published by Forexlive.com. Read the original article here.
