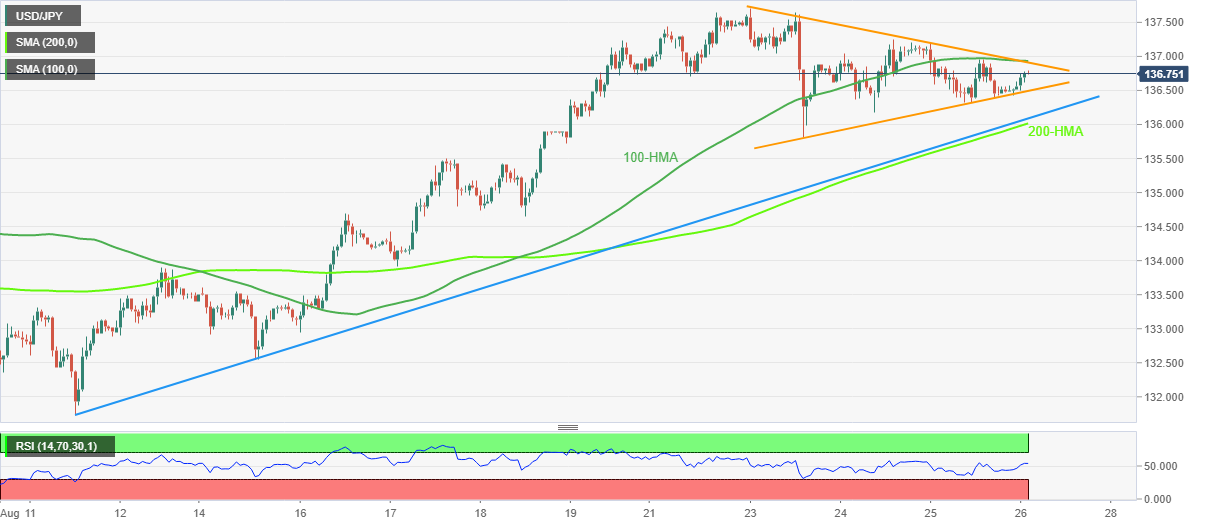
- USD/JPY pares the biggest daily loss in two weeks inside a bullish chart pattern.
- Firmer RSI adds strength to the bullish bias, 100-SMA offers additional hurdle.
- Convergence of 200-HMA, fortnight-old ascending trend line appears key support.
USD/JPY picks up bids to refresh intraday high near 136.80 during Friday’s Asian session. In doing so, the yen pair advances inside a three-day-old bullish pennant.
The upside momentum also takes clues from the firmer RSI (14), not overbought.
However, a convergence of the stated pennant and the 100-HMA, near 137.00, appears a tough nut to crack for the USD/JPY buyers.
Following that, a rally towards refreshing the multi-year high marked in July at around 139.40 could be witnessed. It’s worth noting that the monthly high near 137.70 could act as a buffer during the run-up.
Meanwhile, a downside break of the pennant’s support line, at 136.50 by the press time, isn’t an open invitation to the USD/JPY bears.
The reason could be linked to the existence of the 200-HMA and an upward sloping support line from August 11, close to the 136.00 round figure.
In a case where the USD/JPY bears keep reins past 136.00, the early-month high near 135.60 could become an intermediate halt before directing the anticipated fall towards the monthly low near 130.40.
USD/JPY: Hourly chart
Trend: Further upside expected

