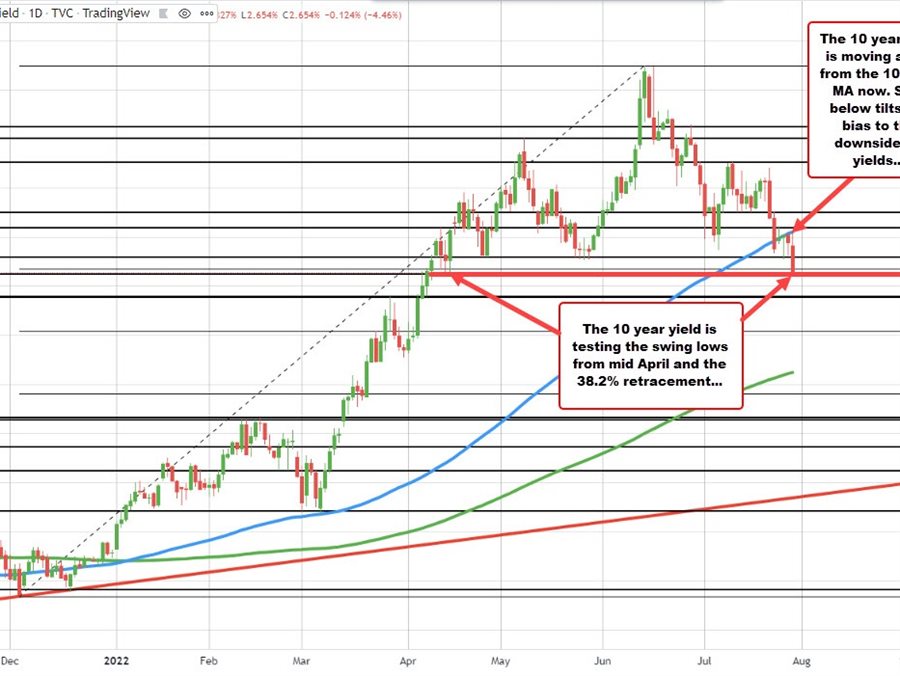
The US 10 year yield is moving sharply to the downside. The current yield is at 2.68%. That’s down around 10 basis points on the day. The low yield reached 2.66%. That was the lowest level since April 14.
Looking at the daily chart above, the yield last Friday moved below the 100 day moving average (blue line in the chart above) for the 1st time since December 2021. On Monday and again yesterday, the price tried to move back above that moving average level, but was forced back below by the close on each day.
Today, the high yield of 2.827% stalled right near the 100 day moving average at 2.820%.
Yesterday Powell’s comments helped to put a lid on the yields. Today the weaker GDP and initial claims has sucked some of the rate hike fears out of market and contributed to the downward momentum.
Technically, staying below the 100 day moving average keeps the bias more to the downside.
The pair is also testing its 32% retracement of the move up from the December 2021 low. That level comes in at 2.671%. Move below and stay below will have traders looking toward 2.557% was a swing high going back to March 28. Below that is the 50% midpoint of 2.417%.
Although the bias has turns more negative, the Fed is likely to continue to raise rates going forward, just at a slower pace. The hike yesterday took the upper end of the Fed funds target to 2.5% which is considered neutral.
The question going forward is how much over the neutral rate does the Fed have to go with inflation still elevated (but likely coming down)? If the trajectory is still to the upside, having the 10 year yield move below the targeted Fed funds rate may have some difficulty. Nevertheless, watch the technicals for the close. For now, the break below the 100 day moving average tilts the bias more in the downward direction
