- GBP/USD remains pressured around two-week low, prints four-day downtrend.
- Clear downside break of seven-week-old horizontal area joins bearish MACD signals, downbeat RSI to favor sellers.
- Bulls to remain skeptical unless crossing monthly resistance line.
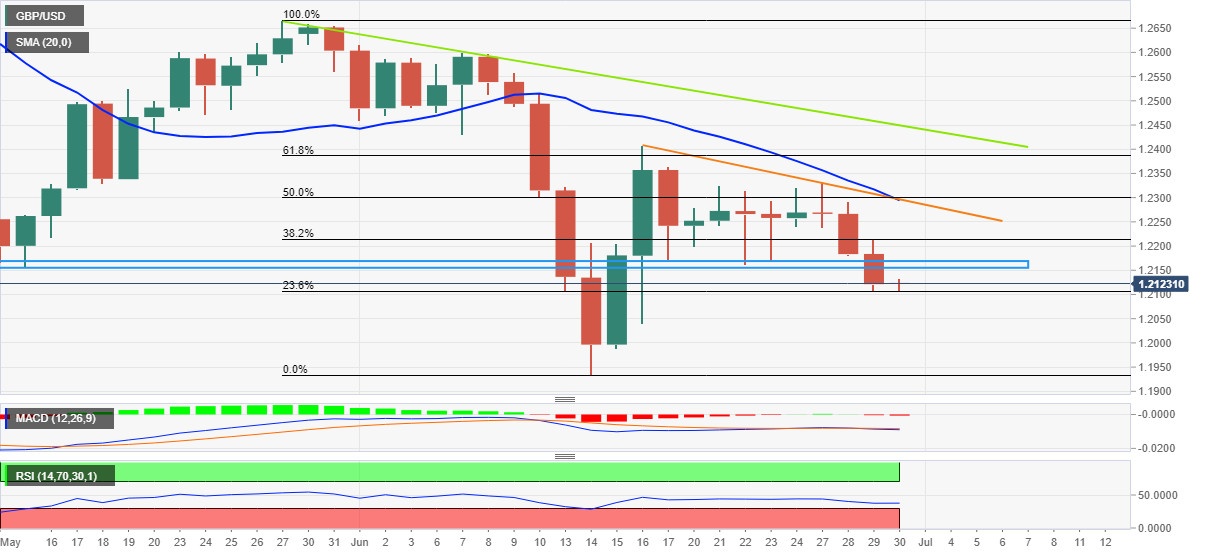
GBP/USD struggles around a fortnight low while defending 1.2100 during Thursday’s Asian session. In doing so, the Cable pair portrays the mixed sentiment of traders ahead of the UK Gross Domestic Product (GDP) and the Fed’s preferred inflation gauge, namely the Core Personal Consumption Expenditure (PCE) Price Index.
Despite the recent corrective pullback, the quote maintains the previous day’s downside break of a horizontal support since May 12, now resistance around 1.2155-70. Also keeping the pair sellers hopeful area the bearish signals from the MACD and the RSI (14).
That said, the 23.6% Fibonacci retracement (Fibo.) of May-June fall, around 1.2100, challenge the quote’s immediate downside ahead of the 1.2000 psychological magnet.
Following that, the GBP/USD south-run could aim for the yearly low of 1.1933 before declining further.
Alternatively, recovery remains elusive until the quote stays below 1.2170, a break of which could direct the pair towards the 38.2% Fibonacci retracement level of 1.2215.
It should be noted, however, that the confluence of the 20-DMA, fortnight-old resistance line and 50% Fibonacci retracement appears a tough nut to crack for GBP/USD bulls around 1.2300.
GBP/USD: Daily chart
Trend: Bearish


 This “NEW CONCEPT” Trading Strategy Prints Money!… (INSANE Results!)
 RULE-BASED Pocket Option Strategy That Actually Works | Live Trading
