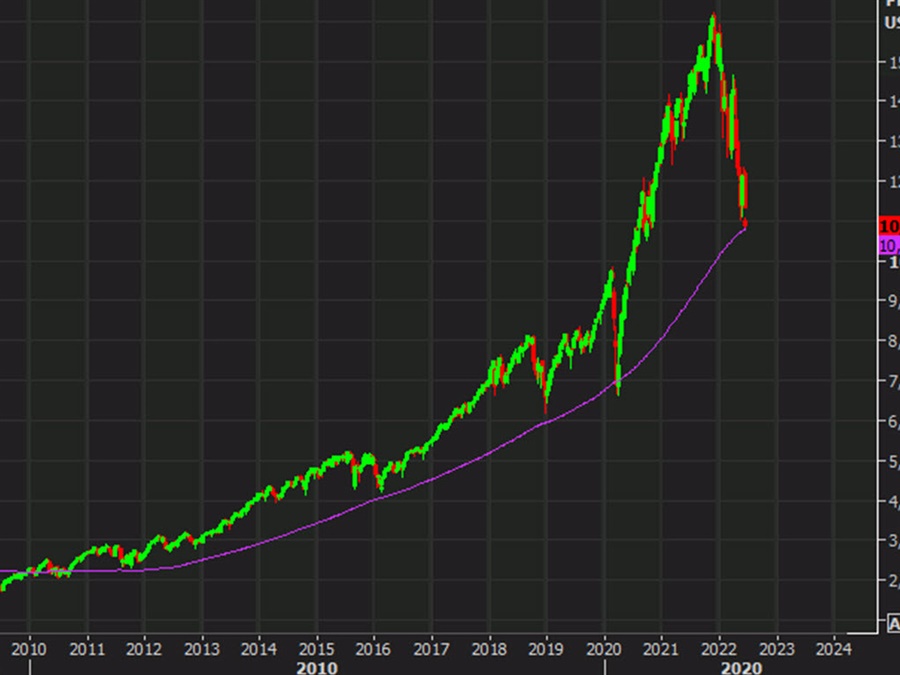
The 200-week moving average has been pivotal in the Nasdaq for decades.
The share since the financial crisis shows it being tested repeatedly and never breaking aside from a two-week period at the height of the pandemic fears.

This level is a good spot for a bounce but if it breaks, it could mean much darker days ahead for tech. The index is down about 33% from the January high but lending is drying up and the market has turned on money-losing companies. Layoffs have already started at some tech companies.
The whole situation is reminiscent of 2000 and many parallels are being drawn to that tech bust. What’s different for me is that there’s a large part of the index that makes money now and that should help to support the index. At the same time, the valuations for the money-losing companies got higher than even in 2000 so further deep declines are possible in that space.
Scaling back on the chart, the 1990 to 2000 chart was similar to the past decade, with steady gains supported by the 200-week MA eventually ending in an incredible spike. There was a strong bounce after first falling substantially below the 200-week in volatile trading. The low-to-high bounce was 28% but it was later wiped out over the course of a month. The bottoming process ultimately took more than two years.

The lessons here are that:
- The 200 week moving average is a key level
- Bear market rallies can be powerful
- The bottoming process could take a long time
Today, the Nasdaq is up but with Treasury yields up 7-13 bps across the curve, the bulls are fighting a tough battle.
