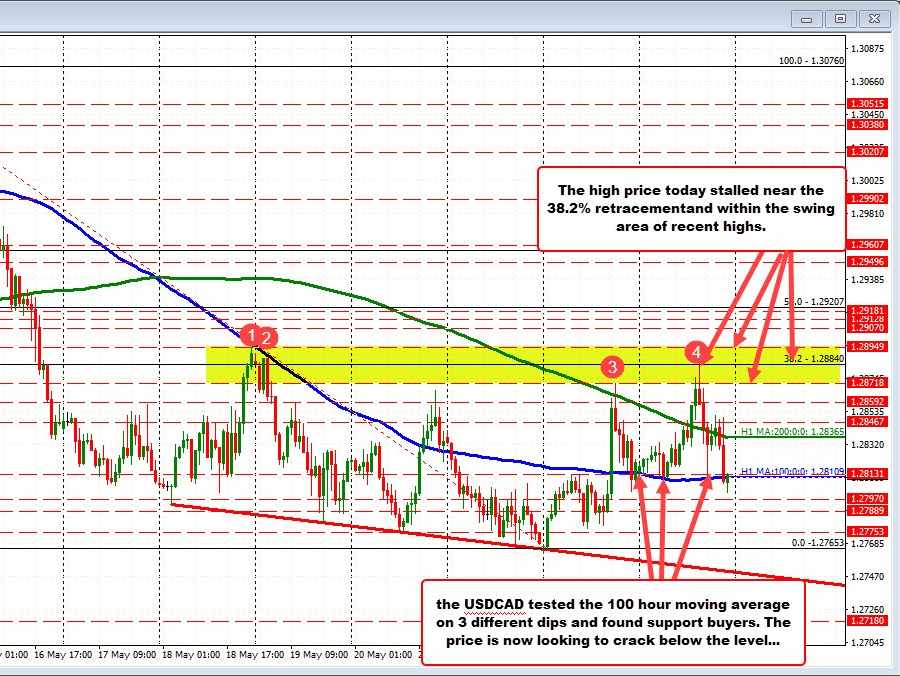
The USDCAD has moved below the 100 hour MA at 1.28109. That moving average had a stalled the fall on a number of dips throughout the day. The break tilts the technical bias more to the downside .
The high price today – reached near the start of the US/North American session – saw the price extend above yesterday’s high at 1.28718, but fall short of the swing high from last Wednesday at 1.28949. The high price today reached 1.28843. That level was also near the 38.2% retracement of the move down from the May 12 high. The 38.2% retracement comes in at 1.2884 where the price move higher stalled. Sellers leaned. Bearish.
The move back to the downside saw the price trade above and below its 200 hour moving average before making the recent run toward and through the 100 hour MA. The door now opens for more downside probing. The swing low from late yesterday comes in at 1.2800. A move below that level and traders will look toward the 1.2775 to 1.2780 area followed by the low price from yesterday at 1.2765.
The downward sloping trend line connects lows from May 18, may 10, May 20 and from Monday and Tuesday lows as well. That trend line cuts across at 1.2750 (and moving lower).
