- GBP/USD bulls moving in and eye a significant correction.
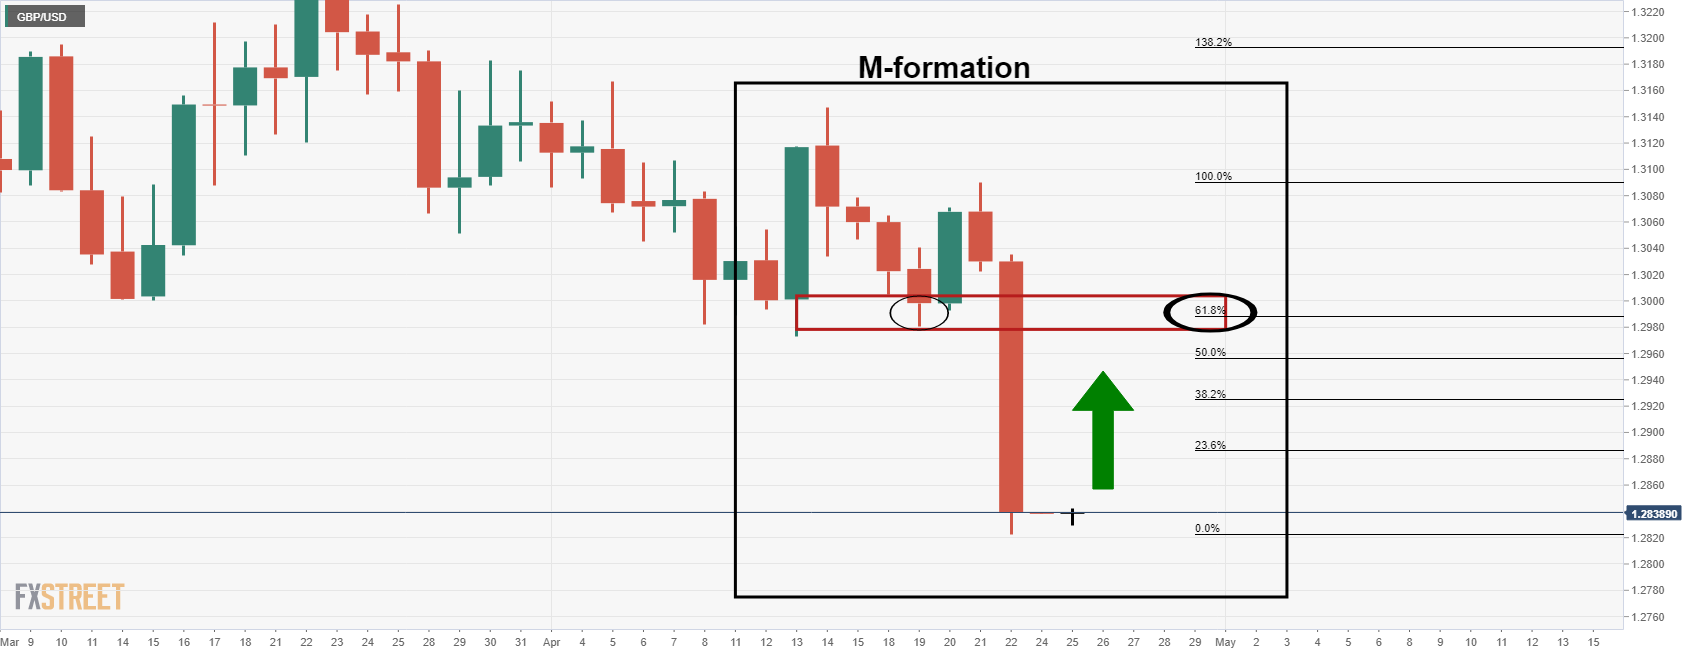
- The M-information is compelling and eye a key confluence area.
GBP/USD is under pressure but the bulls could be on the verge of making a move which would be anticipated to be a significant correction in the days ahead.
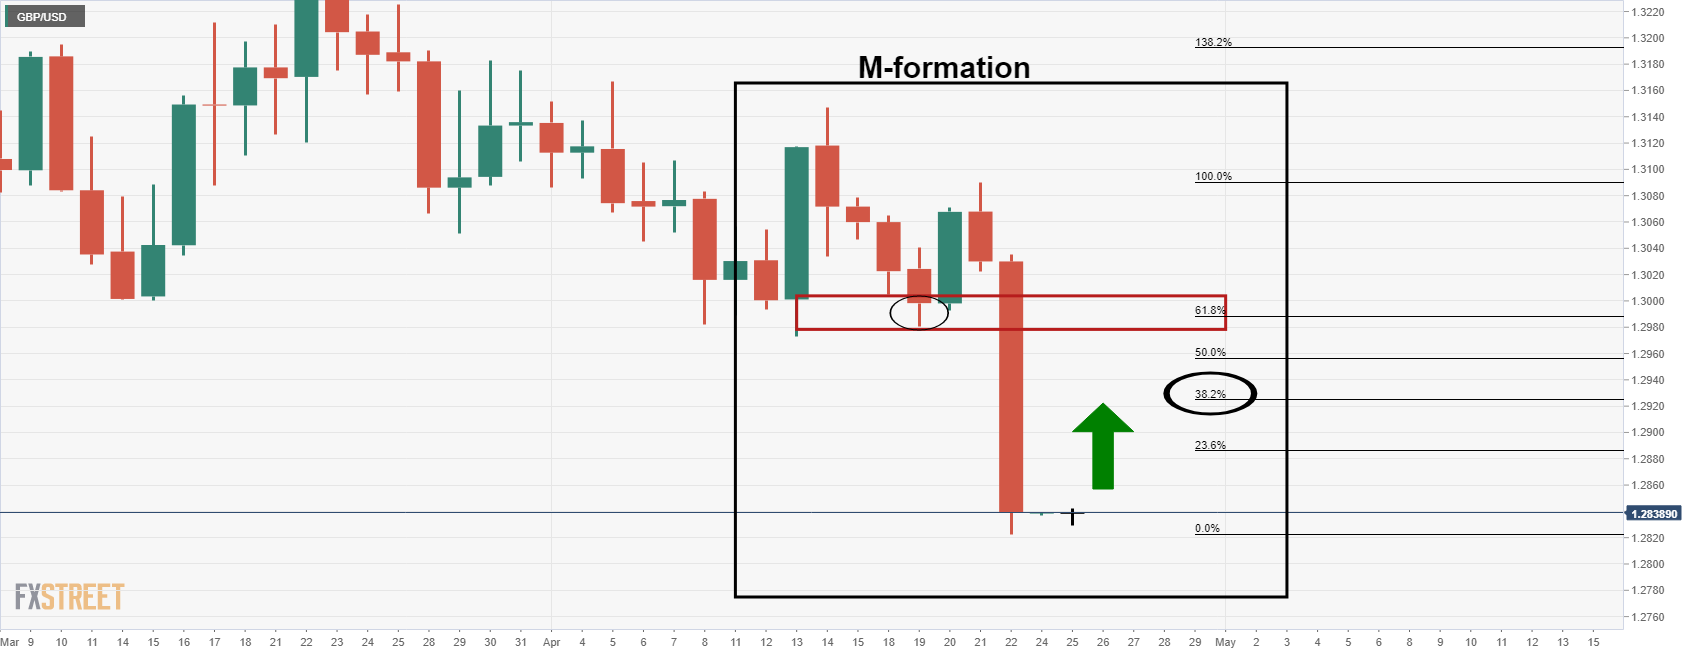
The following illustrates the market structure and prospects of a reversion along the Fibonacci retracement scale.
GBP/USD daily chart
The M-formation is a bullish reversion pattern with a high completion rate whereby the price would be expected to revert to the neckline of the pattern. However, in this case, the pattern is overextended:
In this scenario, the 38.2% Fibonacci could well be a more achievable target given the strength of the sell-off.
This article was originally published by Fxstreet.com. Read the original article here.


