The AUDJPY move to the highest level since June 2015 this week. The high price reached 95.736. The price has run up from 80.36 at the January low. That is a gain of 1537 pips.
After the move to the highs yesterday, the price did rotate back to the downside closing just above the previous days close. However, there was lots of choppy up and down action.
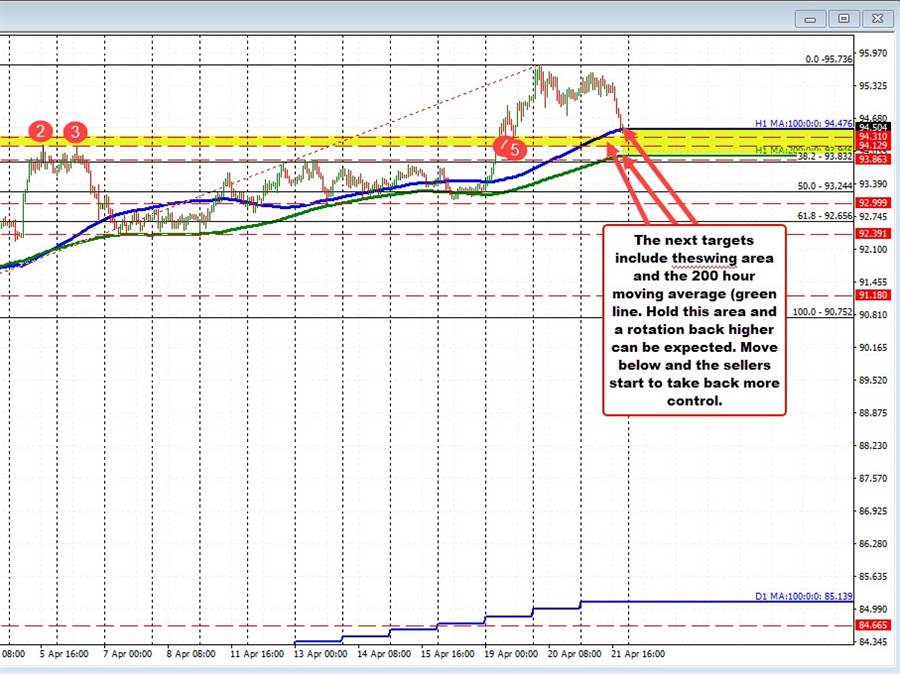
Drilling to the hourly chart below, in trading today a final run toward the high at 95.736 could not be sustained and the last five or so hours have seen a rotation to the downside after lows were taken out.
The price decline is now taken the price to test the 100 hour moving average at 94.476. The current price is trading just above that level at 94.521. Below that level sits swing highs going back to March 28, April 5, and April 6. Those levels come between 94.129 and 94.31. Finally the rising 200 hour moving averages at 93.95. Those are the targets on further selling pressure starting with the break below the 100 hour moving average.
Conversely if the 100 hour moving average can hold support, the dip buyers against the moving average are comfortable. Traders will next be watching the low from yesterday at 94.736 as the first target to get to and through. Move above that and there’s more comfort that the low might be in place.

