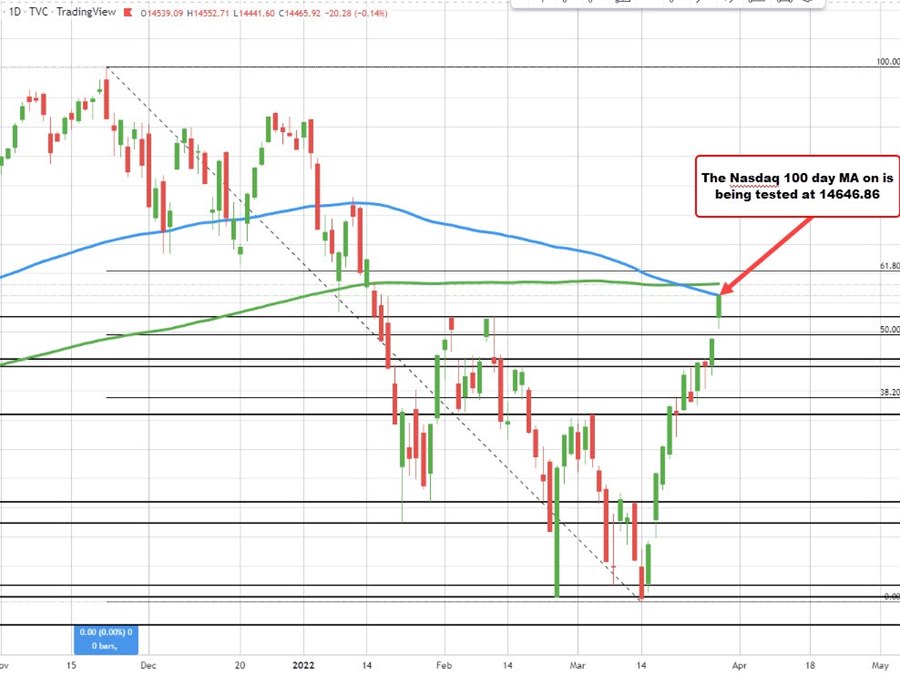
The Nasdaq is testing the 100 day MA at 14646.86.

Technical Analysis

It did not take long to reach the key target outlined in an earlier post, but the NASDAQ index has reached its 100 day moving average at 14648.86. The high price just reached 14646.90. Above the 100 day moving averages the 200 day moving average at 14726.96. It would take a move above both to increase the bullish bias, but so far, the sellers are leaning with 20 minutes left to go in the trading day.

NASDAQ

NASDAQ index reaches its 100 day moving average

Articles You May Like

Gold Price Today: Yellow metal prices fall by Rs 2,260/10 gm in a week, silver down by Rs 5,600/kg
US Dollar edges lower after soft PCE data
Why gold remains vulnerable despite a sharp uptick on Friday
Micron stock headed for worst day since 2020 after disappointing guidance
GBPUSD breaks higher. The next key target area between 1.2596 and 1.26147

Leave a Reply

Your email address will not be published. Required fields are marked *