The USDJPY has moved up 13 the last 14 trading days and in the process has seen a move higher of 740 pips. Yield differentials between the US and the Japan rate has been a big contributor to the move higher (see post here).

The same is true for the EURJPY and the Euro and Japan 10 year yields.
Looking at the chart above of the Euro 10 year minus the Japan 10 year, the spread has move up from -0.25 basis points to +0.27 basis points currently (change of 52 basis points). That has given a boost to the EURJPY in the process.
Looking at the daily chart of the EURJPY below, that pair has seen a move up from 124.38 on March 7 to a high today of 133.95. That represents a gain of 957 pips. The price has been up 11 the last 13 trading days.
Going back to the June 1, 2021 cycle high at 134.117, the pair since then had lower swing highs at 133.47 on October 10, 2020,, and 133.164 on February 10, 2022.
The surge to the upside has now seen the price extend above the most recent swing highs this week/today. The final hurdle is the June 1, 2021 high price at 134.117. Getting above that level would take the EURJPY to the highest level since February 2018.

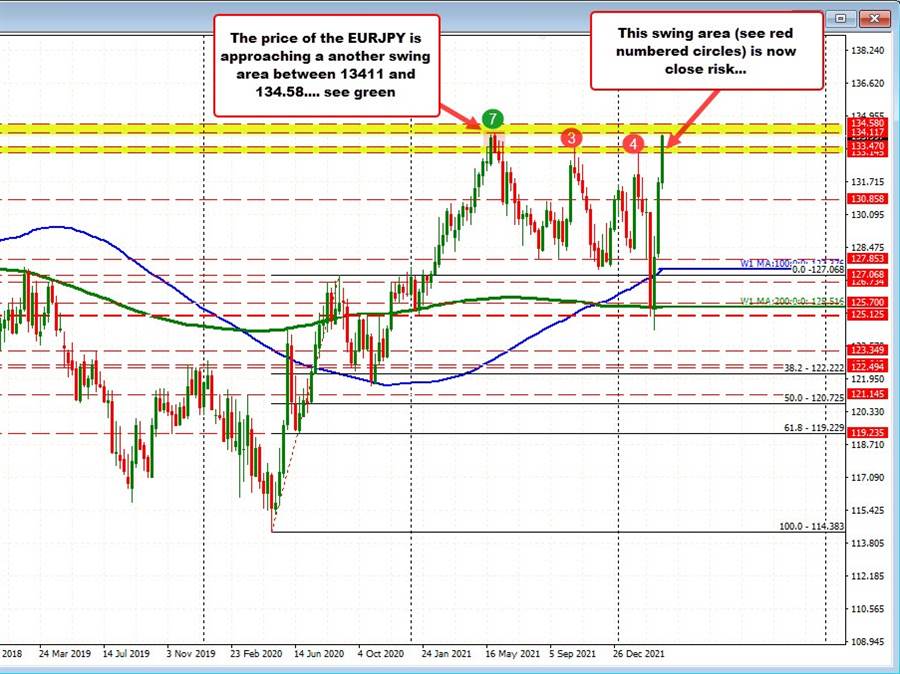
Taking a look at the weekly chart below, the swing highs going back to April and September 2018 reached 133.479 and 133.12 (see red numbered circles 1 and 2 in the chart below). Those are very close to the last two swing highs from October 2021 and February 2022 (red numbered circles 3 and 4).
As a result of that symmetry, that area (between 133.14 and 133.47) is now a support level for buyers. Stay above and the buyers are in firm control, move below and there should be some disappointment on the failure of the break (like with seen after the break higher in May 2021).
On the topside there is a another swing area starting at the 134.11 level (2021 high – green circle 7) and extending up to 134.58 (see green numbered circles on the weekly chart below).
That area would be the next hurdle to get to and through ahead of the extreme from 2017 and early 2018 which took the price all the way up to 137.497.

Like the USDJPY , trends are fast, directional and go farther than what traders expect. The EURJPY is on a trend move to the upside that has now seen the price push above a lower swing area up to 133.47, and now looks toward a higher swing area starting with the 2021 high at 134.117 and extending up to 134.58. Can the next hurdles be reached and breached as the trend higher continues?
