
Having failed to cross the short-term key hurdle around $2,000, gold (XAU/USD) prints mild losses near $1,990 heading into Tuesday’s Asian session. That said, the bright metal rose to the highest levels since last seen during late 2020 the previous day before retreating from $2,002.
While the supply-crunch fears remain on the table, keeping the gold buyers hopeful, a deadlock over the ceasefire and human corridor amid the Russia-Ukraine talks seems to probes the gold buyers of late. “Ukrainian officials said a Russian airstrike hit a bread factory in northern Ukraine on Monday, killing at least 13 civilians, while talks between Kyiv and Moscow made little progress towards easing the conflict,” said Reuters.
The news also quotes Russian media while saying, “Moscow would give the residents of the Ukrainian cities of Sumy and Mariupol the choice of moving elsewhere in Ukraine on Tuesday, setting a deadline in the early hours for Kyiv to agree.”
Elsewhere, the European Union (EU) and the UK’s rejection of the US plan to ban Russian oil imports in totality also seem to have favored the market’s latest consolidation.
Against this backdrop, the US 10-year Treasury yields extend the previous day’s rebound from two-month to 1.8%, up five basis points at the latest, whereas S&P 500 and the Euro Stoxx 50 Futures print mild intraday losses at the latest.
Looking forward, a light calendar and deadlock over the key geopolitical issues may keep challenging XAU/USD moves. However, a pause in Moscow’s invasion of Ukraine may extend the commodity’s latest pullback moves.
Technical analysis
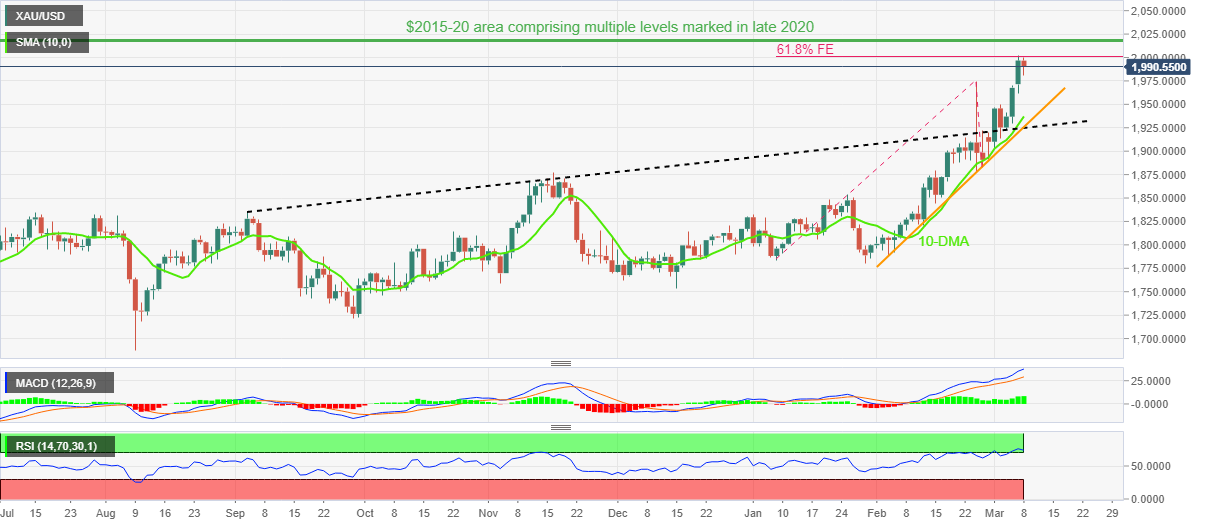
Gold prices step back from the 61.8% Fibonacci Expansion (FE) of January-February moves amid overbought RSI conditions.
As a result, XAU/USD sellers remain hopeful to retest the 10-DMA support of $1,937.
However, any further weakness will be challenged by the convergence of the previous resistance line from September 2021 and the monthly ascending trend line, near $1,924.
On the contrary, a clear upside break of the 61.8% FE level surrounding the $2,000 threshold will direct gold buyers towards the $2015-20 area comprising multiple tops marked since July 2020.
Following that, the year 2020 peak near $2,075 and the $2,100 threshold will gain the market’s attention.
Gold: Daily chart
Trend: Pullback expected