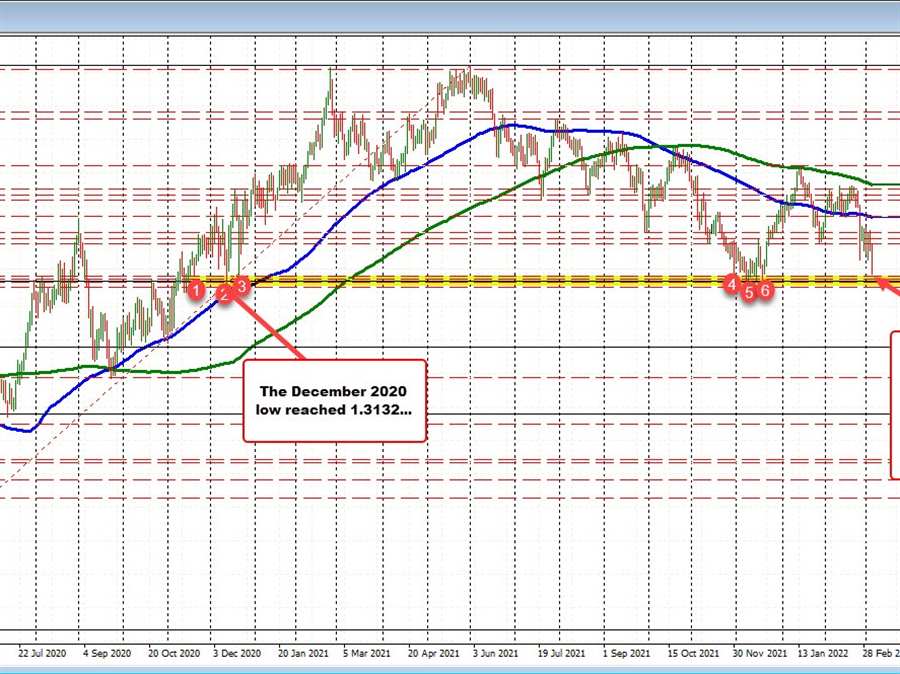
The price of GBPUSD has moved to a new low for the day at 1.32014. Support buyers are seemingly putting a toe in the water near the natural support target. The price is trading back up at 1.3218 as I type.
Looking at the daily chart, be aware that the pair is also approaching the swing lows from 2021. Those levels come in between 1.3159 and 1.3186 (see yellow area in the chart above). The 38.2% of the move up from the March 2020 low is also in that area at 1.3164.
With the low just above the 1.3200 level, the pair has some runway until that area is approached. However, a move below would take the price to the lowest level since December 2020 when the low reached 1.3132. Move below that low and there is even more room to roam to the downside.
Drilling to the 5 minute chart, like other pairs, the GBPUSD has been trending lower today. The move to the downside found sellers near the 200 bar MA (green line), in the Asian session, and that gave the go-ahead to push the price lower.
Momentum increased to the downside in the London morning session with a steep run to the downside.
The last trend leg lower took the price from 1.33187 to 1.32014. The 38.2-50% of that move lower comes in at 1.3246 to 1.3260. The falling 100 bar MA (blue line on chart below) is at 1.3272. IT would take moves above those levels to give the buyers some control Absent that, and the sellers remain in firm control.

