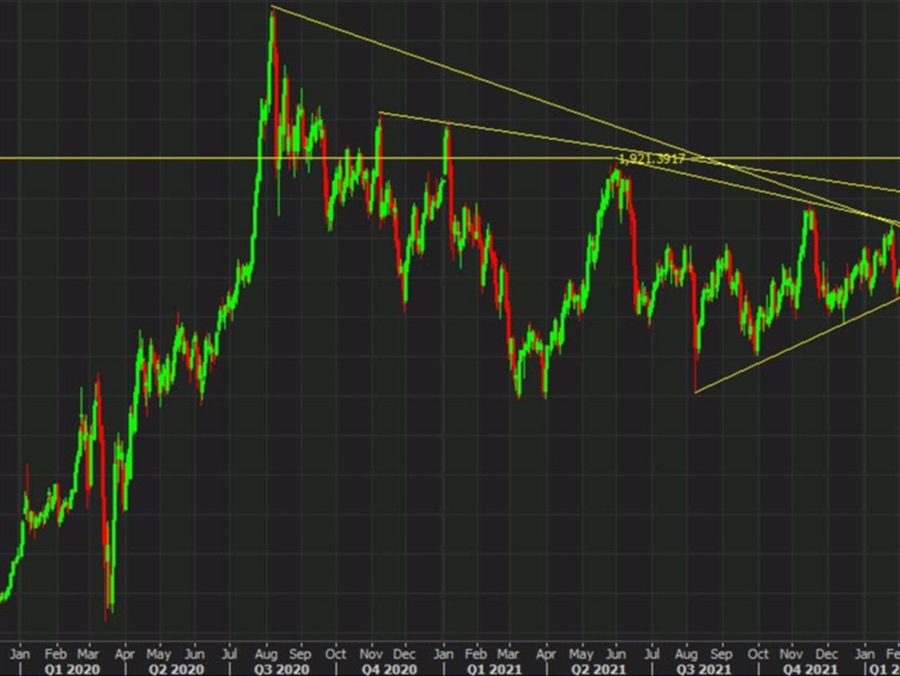
Breaks from wedge consolidation patterns are one of the toughest patterns out there because there are so many old highs in place that could transform the move into a broader range trade.
That said, the spoils of getting a breakout right are incredible. We could be seeing that in gold today as it climbs $30 in a break of $1900.

This is largely a market that has been left for dead but it’s been able to manage the
volatility in bonds and headlines out of Ukraine. The big hurdle will be when (hopefully) that situation calms down and war is avoided. If it can continue to rally through a shift to peace and break through $1920 then the upside here is material.
Meanwhile, bitcoin has extended its daily decline to $3000. Earlier, I warned about potential stops on a break of Monday’s low of $41,555. That’s exactly what’s unfolding in a quick fall to $40,900.

