The price action in the
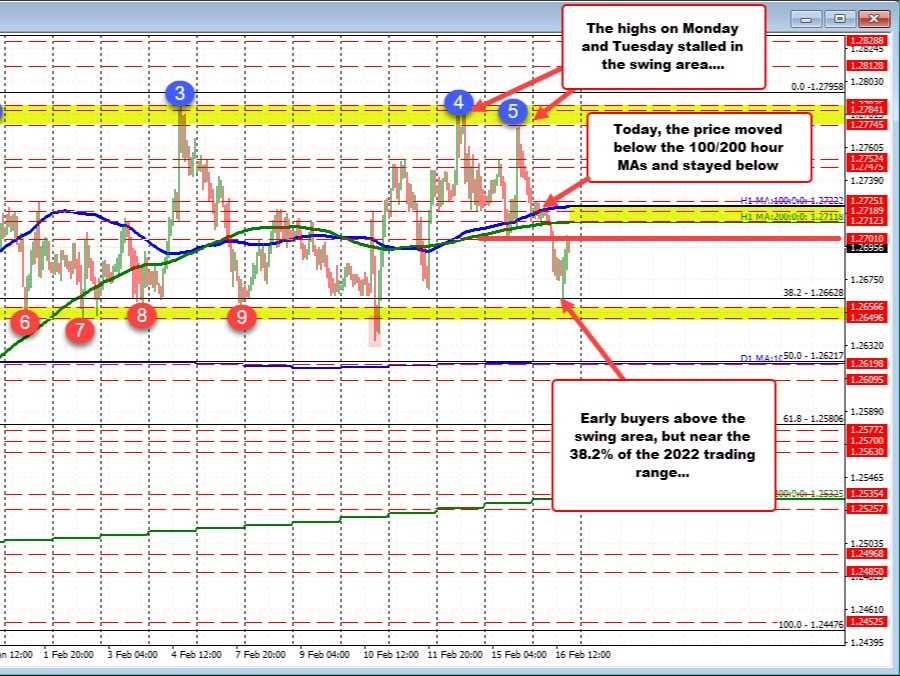
USDCAD since January 26 has been stuck in the mud mostly between 1.26496 and 1.27958.
Yesterday, and on Monday, the price highs stalled near swing highs between 1.27745 and 1.2786 (see blue numbered circles four and five).
The price had traded above those levels back on January 28 and again going back to January 6, but most the price action has been south of those levels.
The subsequent move to the downside that continued today, initially stalled near the 200 hour moving average (green line currently at 1.27118).
However in the late Asian session, the price was able to break below that moving average level, and that increased the downside momentum.
The momentum moved to the downside, took the price to the 38.2% retracement of the move up from the January 19 low to the January 28 high at 1.26628. Since then, the price has rebounded back higher, and in thee process tested the low from yesterday near 1.2701. Sellers have leaned near that level.
Both the 200 hour moving average at 1.2711, and the 100 hour moving average 1.2722 loom above. It would take a move above each to increase the bullish bias going forward.
Needless to say there is a bunch of up and down moves within a fairly narrow trading range, over a 15 day time period (three weeks of trading). At some point, there will be a break and run, but for now, the buyers and sellers are battling it out between the wider extremes.
