Gold price is consolidating the retreat from weekly highs of $1771, as the market mood improves and caps the rebound in the US dollar across its main peers. However, the downside remains more compelling for gold price as looming concerns about higher price pressures, the US debt ceiling and China’s debt-laden property developers will continue to underpin the safe-haven demand for the US dollar.
Read: Gold Price Forecast: XAU/USD awaits acceptance below $1750 to resume the downside
Gold Price: Key levels to watch
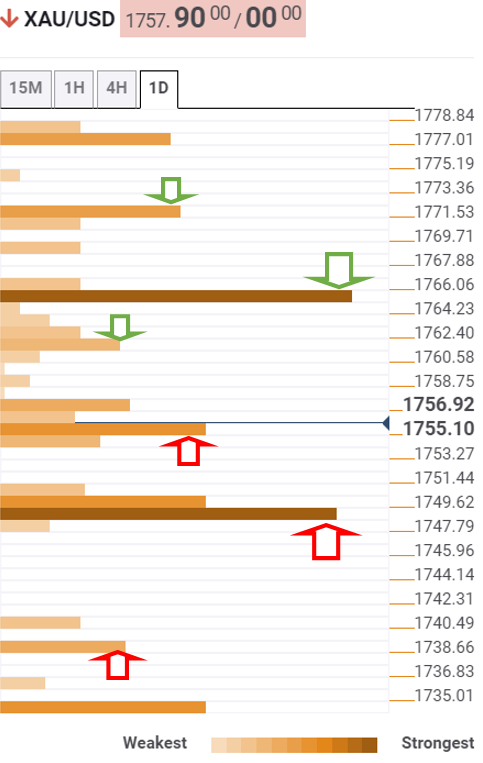
According to the Technical Confluences Detector, gold is eyeing a sustained move below minor support at $1755, which is the convergence of the SMA10 one-day, Fibonacci 23.6% one-week and pivot point one-day S1.
The next crucial cushion is seen at $1749, where the SMA5 one-day, Fibonacci 38.2% one-week and Fibonacci 23.6% one-month coincide with the previous day’s low.
A sharp drop towards the Fibonacci 61.8% one-week at $1738 cannot be ruled on a breach of the abovementioned strong support.
On the flip side, the Fibonacci 38.2% one-day at $1761 will cap the immediate upside, above which the previous week’s high at $1764 will test the bearish commitments.
Acceptance above that level could trigger a fresh advance towards $1771, the daily high.
Here is how it looks on the tool
About Technical Confluences Detector
The TCD (Technical Confluences Detector) is a tool to locate and point out those price levels where there is a congestion of indicators, moving averages, Fibonacci levels, Pivot Points, etc. If you are a short-term trader, you will find entry points for counter-trend strategies and hunt a few points at a time. If you are a medium-to-long-term trader, this tool will allow you to know in advance the price levels where a medium-to-long-term trend may stop and rest, where to unwind positions, or where to increase your position size.

