- AUD/USD struggles at 0.7300 as the market mood is risk-averse.
- Evergrande’s failure to pay its bond interest weighs in the AUD.
- Australian Retail Sales and Building Permits for August could provide fresh impetus to AUD/USD.
Earlier in the Asian session, the aussie was trading at daily highs around 0.7310’s, on the back of the positive market sentiment, amid the hawkishness showed by the Federal Reserve on Wednesday monetary policy statement and dot-plot. Nevertheless, Evergrande’s woes and failure to pay the dollar bond coupon changed the market’s mood to risk aversion, thus benefitting the US Dollar. At the time of writing, the AUD/USD is trading at 0.7253, recording a loss of 0.56% during the day.
The Australian dollar is the most exposed to China’s woes – ING
According to ING, the Australian dollar is the most exposed currency for any spillover from a potential Evergrande’s default. The rationale is that Australia is the most Chinese-dependant country in the G10. A collapse in the real estate market would raise further demand concerns in the iron ore market, generating another sell-off in the commodity’s price.
That said, further in the next week, in Australia, the Retail Sales and the Building Permits for August in a month-over-month reading could be catalysts for the AUD/USD pair.
Moreover, the US economic docket is packed with Durable Good Orders, Consumer Confidence for September, GDP monthly and yearly basis figures, Initial Jobless Claims for the week ending on September 23, and the ISM Manufacturing readings for September.
AUD/USD Price Forecast: Technical outlook
Daily chart
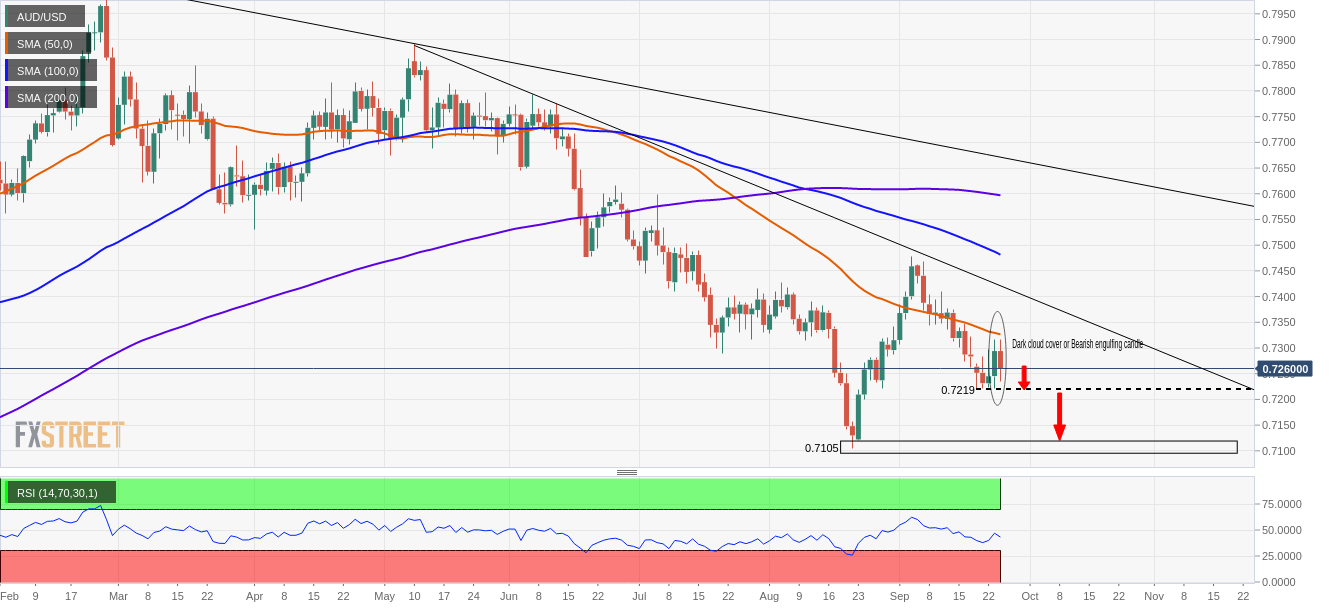
The AUD/USD is trading at the mid-point of the trading range of the day.
The price action of the last two candles suggests that a Dark-cloud cover or a bearish-engulfing pattern might be forming. Either way, both have bearish implications. The first one is a weaker signal, and it will need confirmation. The second is a strong signal, though it will require a daily close below 0.7245 to confirm its validity.
In case of that outcome, the first support on the way down would be the September 20 low at 0.7219. A decisive break of the latter could expose the 2021 low at 0.7105.
The Relative Strenght Index is at 43, heading lower, supporting the downtrend.

 #shorts #crypto #forex #trading #patterns