Moving averages stalls the ups and downs today
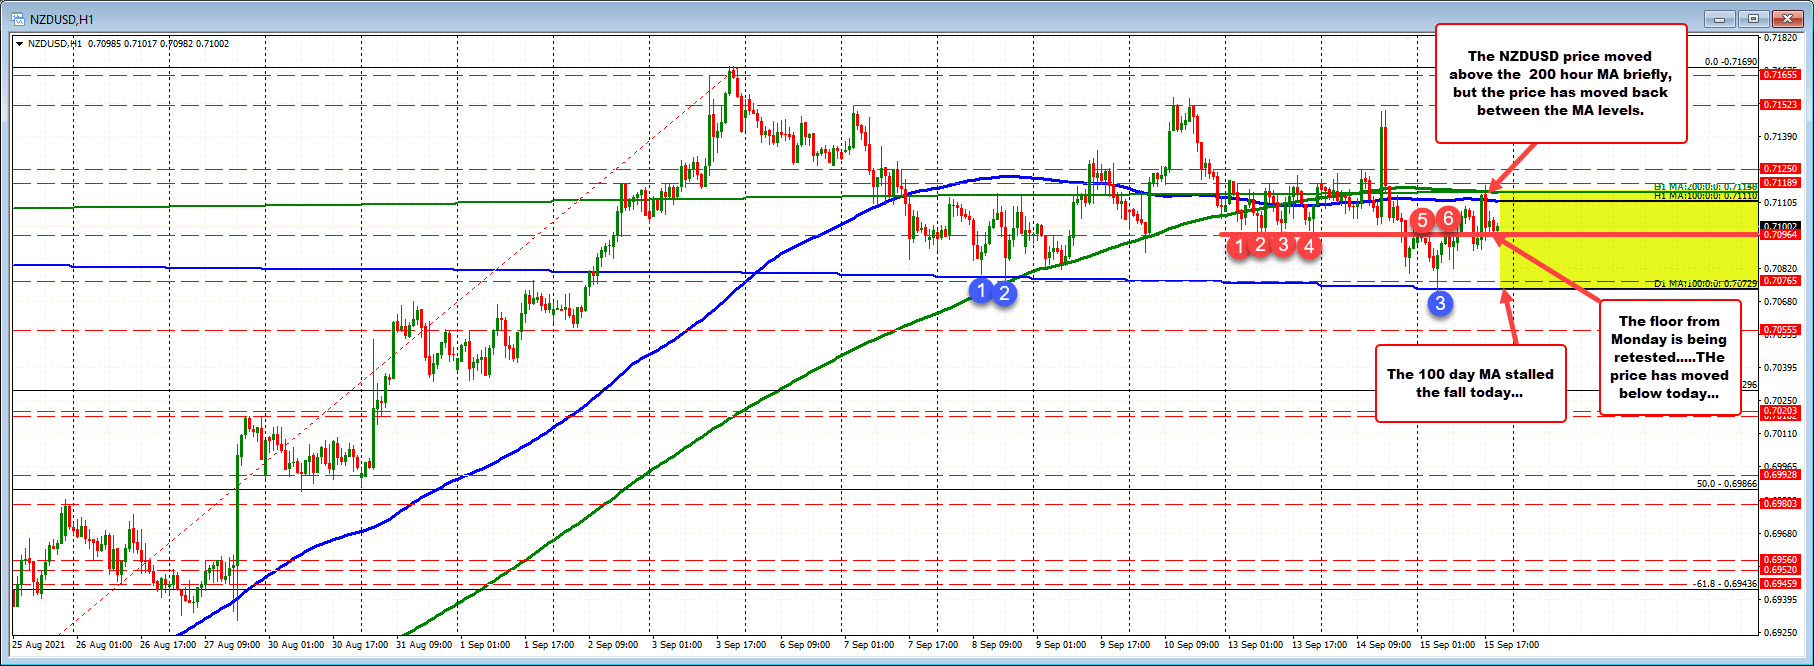
The NZDUSD down to test its 100 day moving average in the Asian session at the 0.70729 level. The low price for the day reached 0.72726.going back to September 8 and September 9, the price declines had found support against that daily moving aveerage level.
The subsequent rise off that key moving average support, saw the price move up to test the 100 hour, 200 hour and 200 day moving averages between 0.7111 and 0.71148. The high price reached 0.71175 – just above that area. The momentum could not sustained, and the price has rotated lower in the New York session.
The current price is trading at 0.7100. Going back to Monday, there was a number of flows between 0.70964.and 0.70999. The price today has been below that level but the last three hours has seen the price stay above. If the price is going lower, getting below 0.70964 and 0.70999 would be eyed as step one. The next step is to get and stay below its 100 day moving average. The price has not closed below that moving average since September 1.
