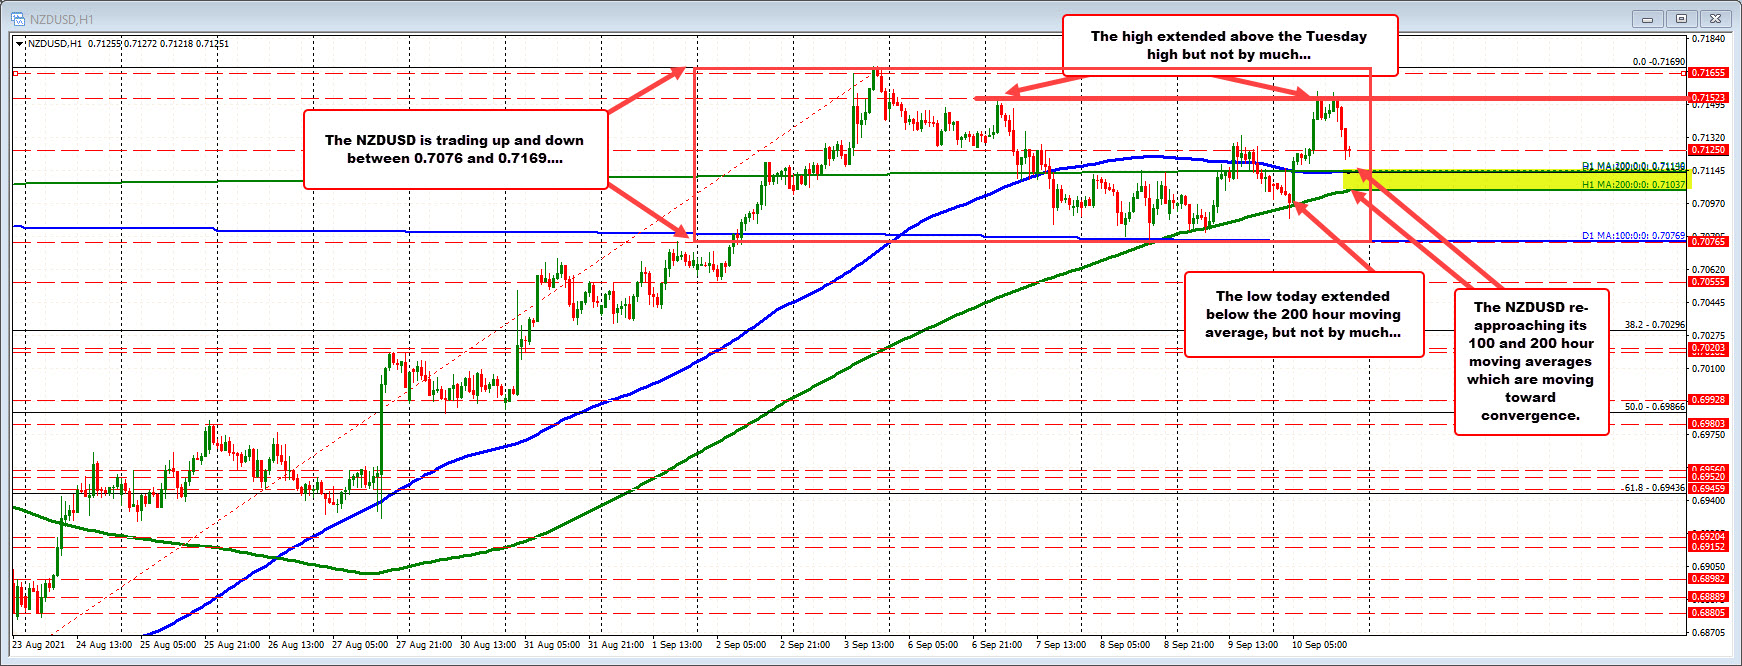
The 100 hour moving average and 200 day moving average are convergent 0.7114
The NZDUSD has been rotating back to the downside after an attempt to get above Tuesday’s high at 0.71523 failed. The pair was higher earlier in the day as stocks opened with solid gains, but those gains were eroded and the prices started to move back down.
The pairs price is approaching the 100 hour moving average and 200 day moving average which are both at the 0.7114 level. Below that the 200 hour moving average comes in at 0.71037. Earlier today, the price did dip below the 200 hour moving average (in the Asian session), but selling dried up and the price quickly rebounded.
For the week, the low was set on Wednesday near the 100 day moving average and the rising 200 hour moving average (green line). At that time, those moving averages were near 0.7076. Buyers leaned against the level and based against the 200 hour moving average on Thursday before moving higher.
The price has traded between 0.7076 and 0.7169 since September 2. At some point, the price will break out of the range seen since that time.
