- Apple stock still golding near all time highs.
- AAPL shares look ready to fall.
- Results were 30% ahead of estimates but the stock has not pushed on.
Apple stock continues to trade just under all time highs at $150 and is in a sideways range will little strong direction to get our trading teeth stuck into. But as we have cautioned several times before this is the extra skill of trading, knowing when to sit it out and wait for the opportunity. Apple has not reacted in line with strong results for the second set of results in a row. Last time around in April results came in 40% ahead of estimates and the stock went from $137 to $122 in a matter of days. This time around Earnings Per Share (EPS) comes in 30% ahead of those estimates but Apple stock does not do much and tests $150 briefly before heading south and stabilizing at $146. So is this stabilizing for a push higher or a negative sign after strong results?
We think the latter and will get into the technical side of things to explain why. But first just a quick recap on the results and key stats for Apple.
Apple released Q3 2021 results on Tuesday, July 27. Earnings per share (EPS) were $1.30 versus the $1.00 Wall Street estimate. Revenue was $81.4 billion versus the $72.9 billion estimate. The tech giant reported Q3 iPhone revenue of $39.6 billion, up from $26.4 billion a year earlier. Apple stock attempted to push on once results were out but failed to hold any gains.
Apple key statistics
| Market Cap | $2.4 trillion |
| Enterprise Value | $2.1 trillion |
| Price/Earnings (P/E) | 29 |
|
Price/Book |
38 |
| Price/Sales | 9 |
| Gross Margin | 41% |
| Net Margin | 25% |
| EBITDA | $112 billion |
| Average Wall Street rating and price target |
Buy $165 |
Apple stock forecast
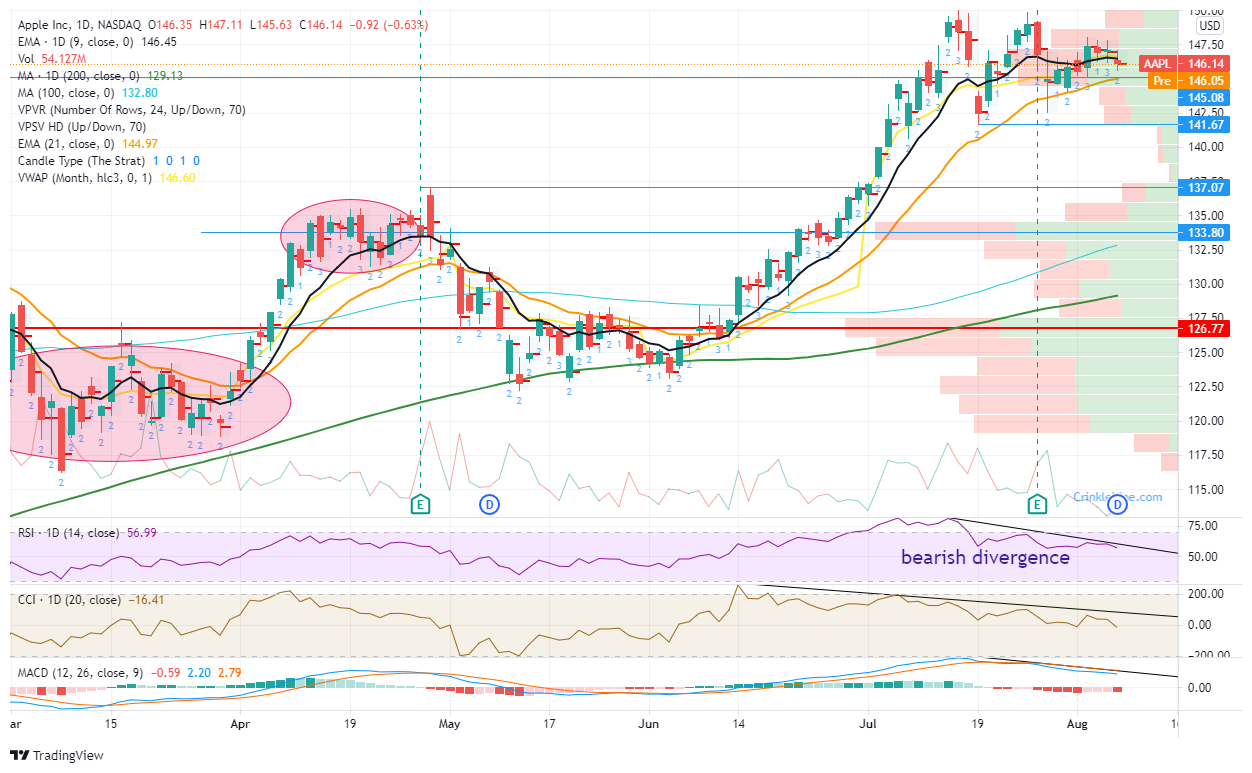
Apple has put in place a potential double top formation with a top of $150 set in early July and again just after results. A double top is a negative bearish formation but the trigger for entering positions is when the first pullback is broken. In this case that puts the trigger at $141.68. As of yet, Apple stock has not broken this level so it is not quite as bearish just yet. However, what we can see from the volume profile on the chart below is that if this level breaks there is hardly any volume to support the price so the move could and should be a sharp one. Breaking $141.68 should see a swift move to $133.80, the next high-volume support area. Adding to our current bearish stance is the bearish divergence from the main momentum oscillators. A bearish divergence occurs when the stock makes a new high (the second test at $150) but the momentum oscillators are trending lower as shown. The Relative Strength Index (RSI), Commodity Channel Index (CCI), and Moving Average Divergence (MACD) are all trending lower.
To sum up then our bearish theory
1. Bearish double top has formed but yet to trigger.
2. Bearish divergences across the main momentum oscillators.
3. Apple stock has broken the 9-day moving average.
4. Apple was relatively downbeat on the post earnings conference call.
That’s four reasons but who’s counting!
Like this article? Help us with some feedback by answering this survey:

-637640939031335691.png)
