The 100 hour MA is in play now
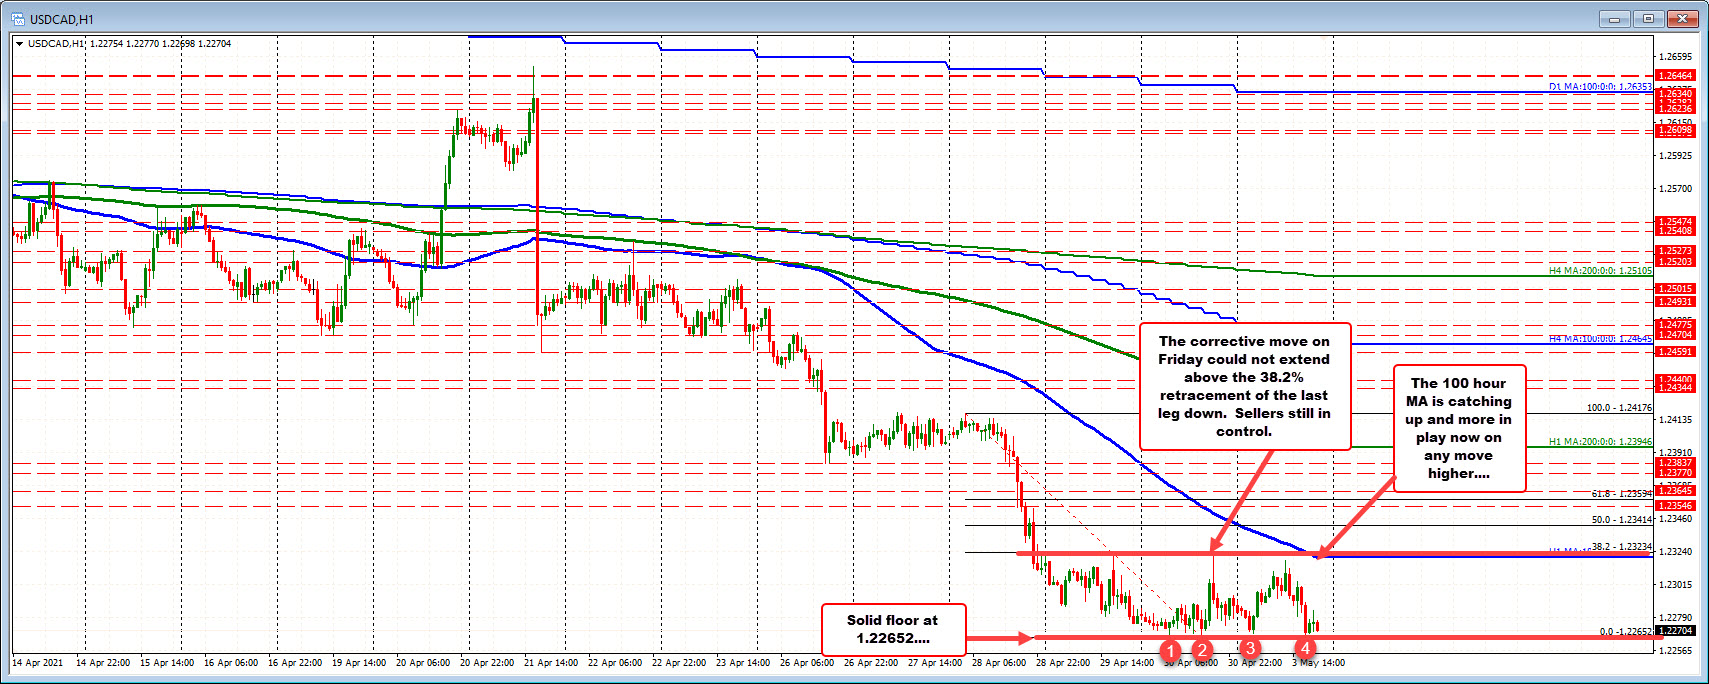
The USDCAD has been waffling up and then down in trading today. The “up” moved to test the high from Friday and Thursday but fell short of those levels. Also above is the 38.2% retracement of the move down from Wednesday’s corrective high (at 1.23234). The high on Friday stalled just short of that last leg lower (the high reach 1.23218). Not being able to extend above that minimum target, has kept the sellers firmly in control.. Putting in another way the buyers are not proving that they can and keep control.
Although the sellers are in control, the buyers have been able to create a sideways trading environment over the last three days with a solid floor at 1.22652 (see rev numbered circles). As result of the sideways market, the 100 hour moving average (blue line in the chart above) has started to catch up and come into play. It currently comes in just below the 38.2% retracement 1.23196 level (and moving lower).
With the 38.2% retracement of 1.2323 and the falling 100 hour moving average 1.23196, market traders have a reference for risk and bias on the topside. Stay below each keeps the bias lower. Move above (and stay above) and there should see more corrective action higher.
On the downside, the solid floor at 1.22652 need to be broken to weaken the dip buyers attempts to “bottom the market”, and give the the sellers more control.
