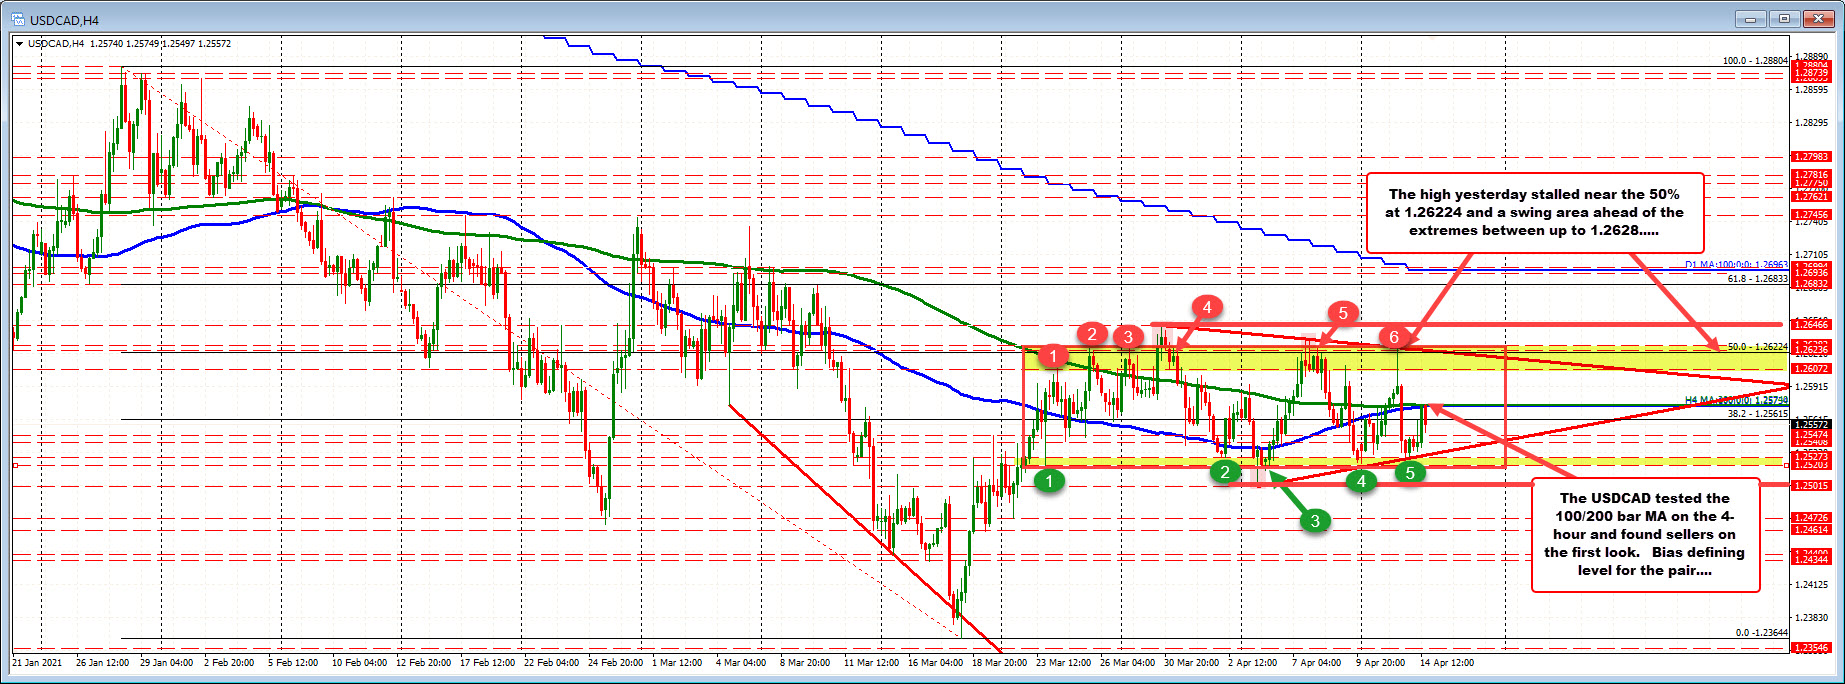
USDCAD finds sellers on the test of the converged 100/200 bar MA on the 4-hour chart.
The USDCAD has traded mostly between 1.25203 and 1.2628 (108 pips) going back to March 23 (3-4 weeks). The larger range (including extremes) have seen the price bottom at 1.2501 and a high at 1.26466 (145 pips). Looking at the 4-hour chart below, the high price yesterday reached near the 50% of the move down from the 2021 high (from January 28) at 1.26224. The high price reached 1.2627 (which was just below the inside range high at 1.2628). The tumble lower tested the high of a lower extreme at 1.2527 (the low reached 1.2526).
Today, the price has rebounded back to the 100/200 bar MAs on the 4-hour chart at 1.25794 (the MAs are virtually converged) and found willing sellers. The price is currently at 1.2552.
Needless to say, the pair has seen a number of ups and downs over the last few weeks. The inside range is narrow at 108 pips. The outer range over 3-4 weeks is also narrow. The sellers yesterday leaned against the topside resistance and then buyers leaned against the lower support.
The holding of the 100/200 bar MAs today is a bearish clue. Stay below would keep the sellers more in control with work to do.
Ultimately, it would take a move below 1.25203 (and stay below) to give the sellers the break they need.
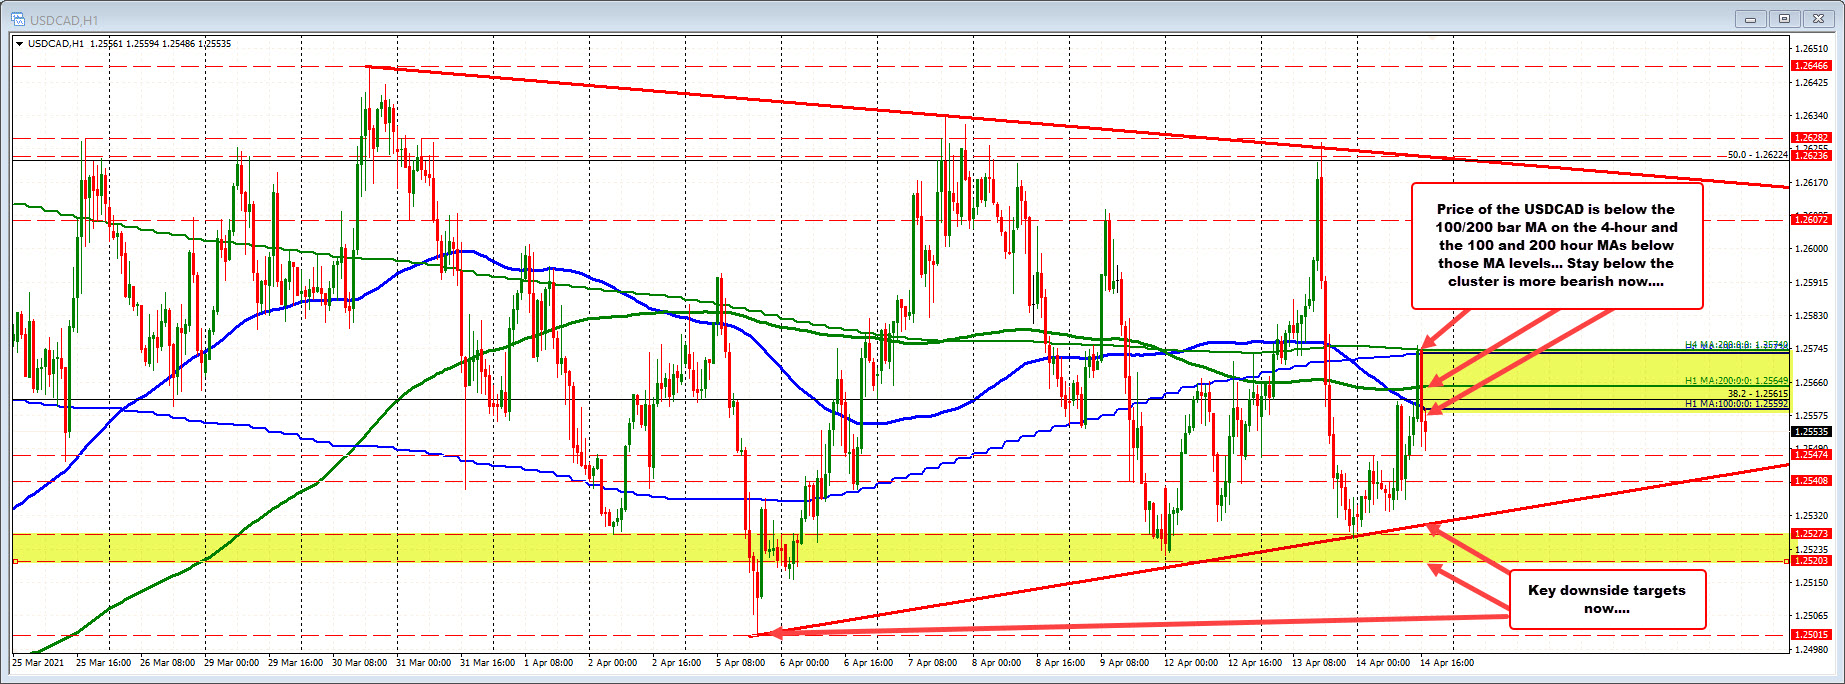
Drilling to the hourly chart below, the ups and downs has also led to the 100 and 200 hour MA toward each other (at 1.2559 and 1.25649 respectively). The price is trading below those levels now but needless to say there is a lot of choppy price action above and below those levels too.
The lesson, nevertheless, is that the markets can and will non-trend and chop. Traders need to dig in and look for clues however from the price action that might shed some light on “the markets” bias. The holding of the 100/200 bar MA on the 4-hour chart today is a bearish clue. Stay below keeps the sellers in control. The price is also below the 100/200 hour MAs as well. Stay below all of those MAs and traders will eye the swing low targets.

