Back below 100/200 hour MAs
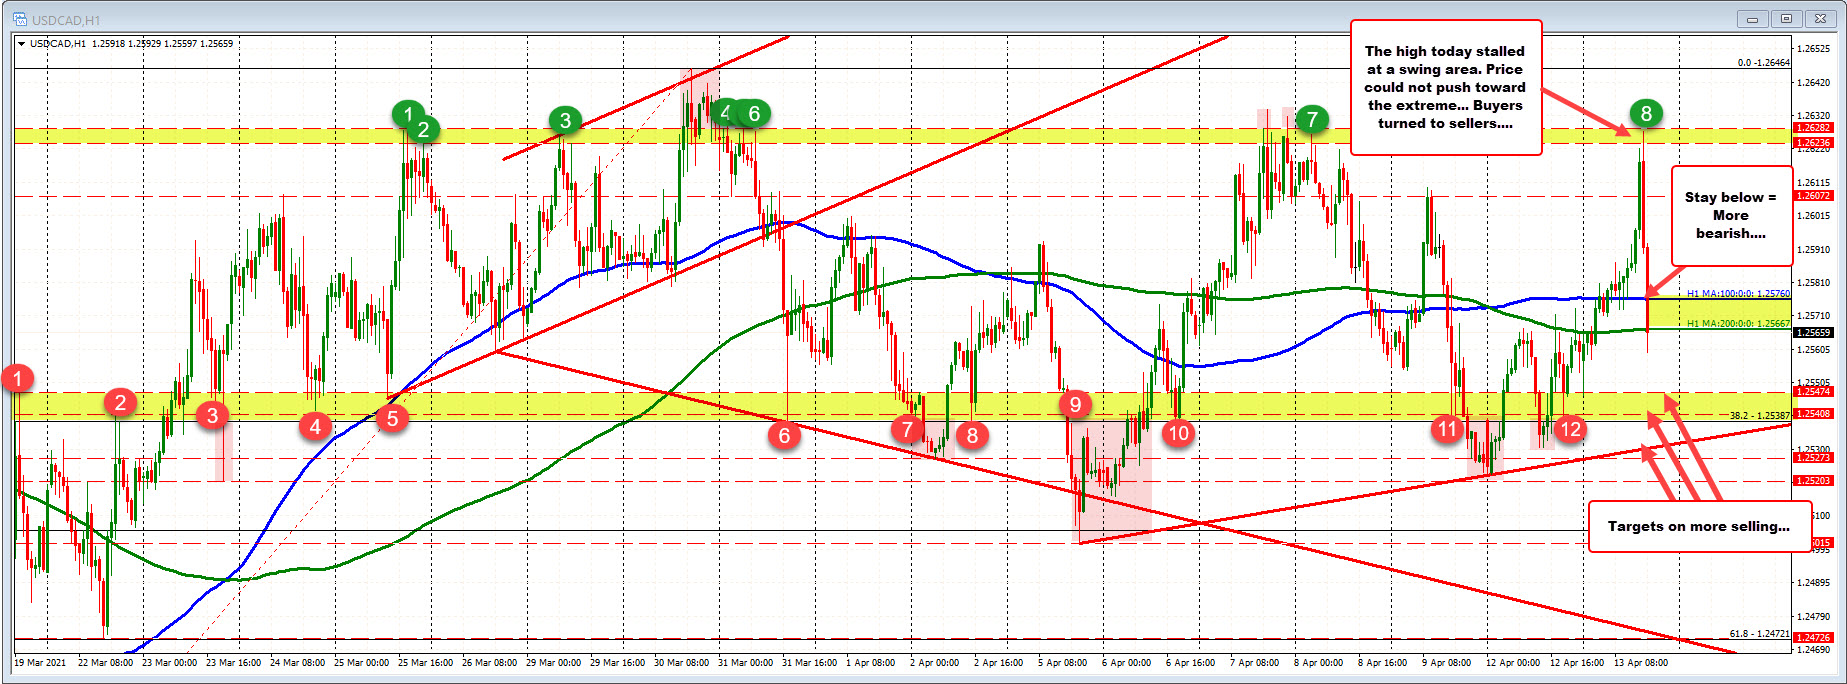
The USDCAD moved higher into the North American session, but ran into a topside swing area between the 1.2623 to 1.2628. The high reached between those levels and quickly reversed back to the downside.
The price is now move back below the 100 and 200 hour moving averages (blue and green lines) between 1.2576 and 1.2566. Traders will now look for the price remain below that higher moving average at 1.2576 to keep the bears more in control.
The USDCAD has been trading up and down with no discernible trend. The aforementioned moving averages are sitting in the middle of where most of the trading has taken place. The downside swing area comes between 1.25387 and 1.25474. Yes, the price is traded below that area on a number of occasions going back to March 23 (including yesterday and on Friday), but most of the price action since March 24 has in between the yellow lines.
At some point the price will start to trend either higher or lower. For now, the pair non-trends in volatile up and down price action.
