Holds gains on the day, but in a neutral area
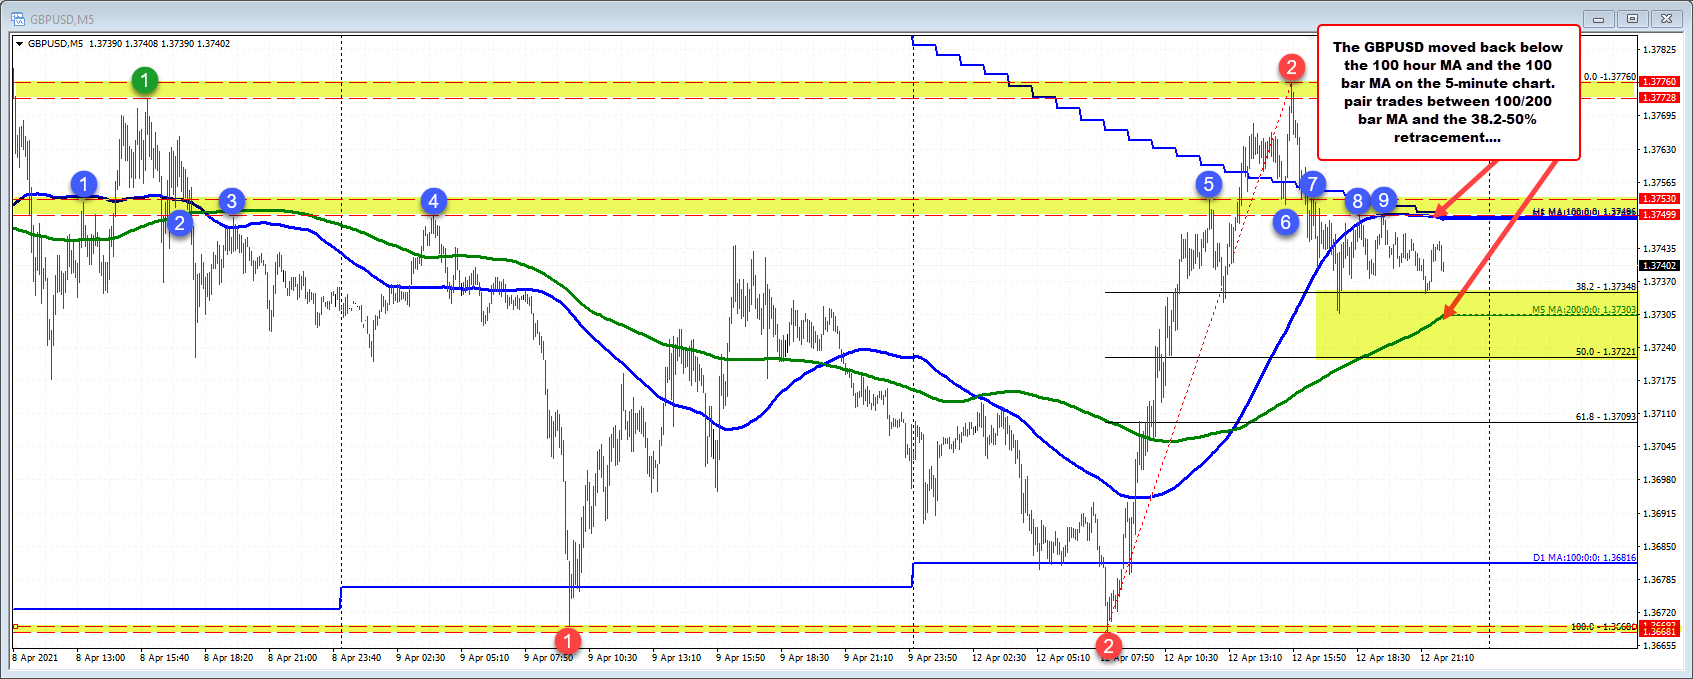
The GBPUSD opened the NY session with strong gains that took the price above its 100 hour MA. However, for most of the NY session, the price corrected lower, falling back below the 100 hour MA currently at 1.3748. On the way, the pair fell below a swing area at 1.3749 to 1.3753 (see blue numbered circles).
The pair has moved down to test the 38.2% of the day’s trading range at 1.37348. Below that is the 200 bar MA on the 5 minute chart at 1.37308, and then the 50% of the range at 1.37221. Moving below those levels would weaken the technical bias for the pair. Stay above (especially the 200 bar MA) and then move back above the 100 hour MA, would keep the buyers in play.
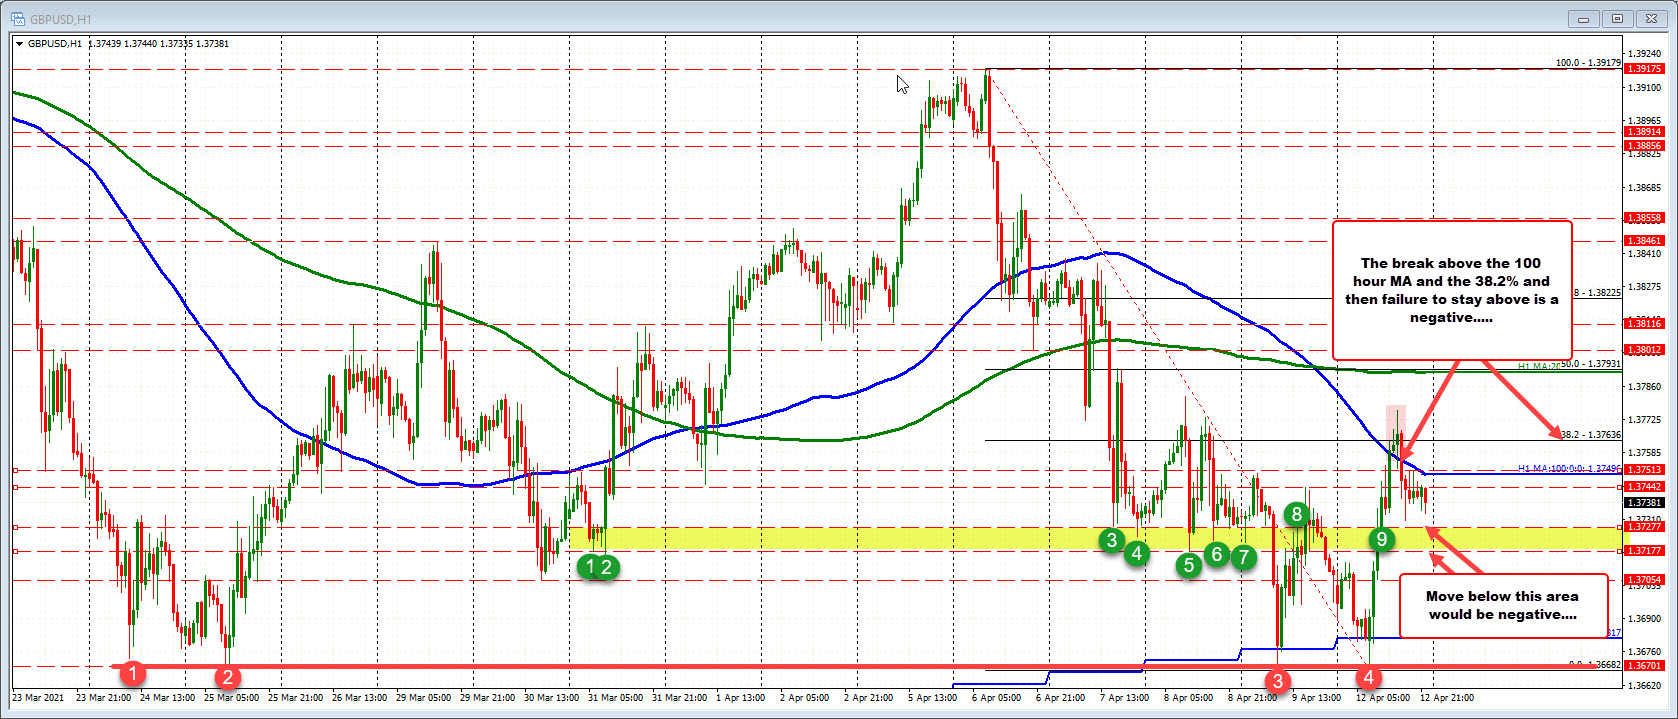
Taking a broader look at the hourly chart below, the move higher today based at the swing low from March 25 (see red numbered circles). Hence the sharp run. However, the break above the 100 hour MA and 38.2%, and then the failure of those breaks, pour a bit of cold water on the run higher. Watch the 1.37177 to 1.37277 now for bias clues on that chart (see green numbered circles). A break below increase the bearish bias and have traders thinking the run higher today was a corrective run off the lows.