
- Gold looks for acceptance above 200-SMA at $1736 on the 4H chart.
- The RSI stay well above the midline, allowing more gains.
- US dollar weakness to aid the recovery momentum in XAU/USD.
Gold (XAU/USD) is bracing for another leg to the upside, as the bulls look to extend the recovery from three-week troughs of $1677.
The weakness in the US dollar and Treasury yields continues to lend support to the XAU bulls. However, the improved market mood on the economic optimism plays could likely play a spoilsport.
From a near-term technical perspective, gold is locked in range so far this Tuesday, as observed on the four-hour chart.
The 200-simple moving average (SMA) at $1736 is the level to beat for the XAU bulls while the recovery momentum remains alive so long as gold holds above the 100-SMA at $1724.
Although, the upside appears more compelling for the precious metal, as the Relative Strength Index (RSI) holds firmer at 60.79. The technical indicator holding above the 50.00 level suggests a bullish outlook.
Recapturing the 200-SMA hurdle could expose the psychological $1750 level, above which the March 18 high at $1756 could be retested.
Gold Price Chart: Four-hour
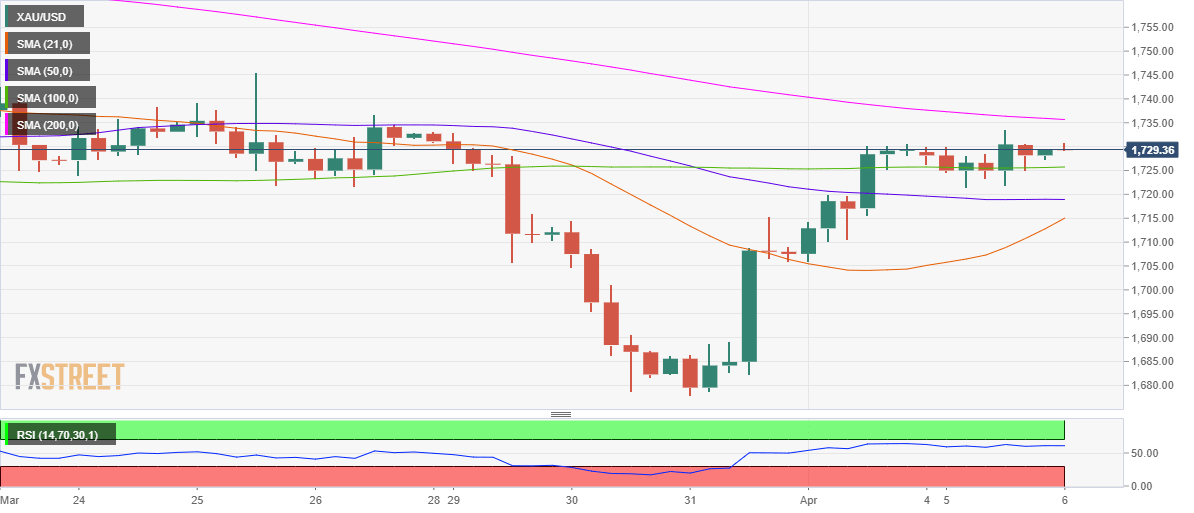
To the downside, if the 100-SMA support gives way, the horizontal 50-SMA at $1719 could be back in play.
Further south, the upward-pointing 21-SMA at $1715 is likely to save the day for the XAU bulls.