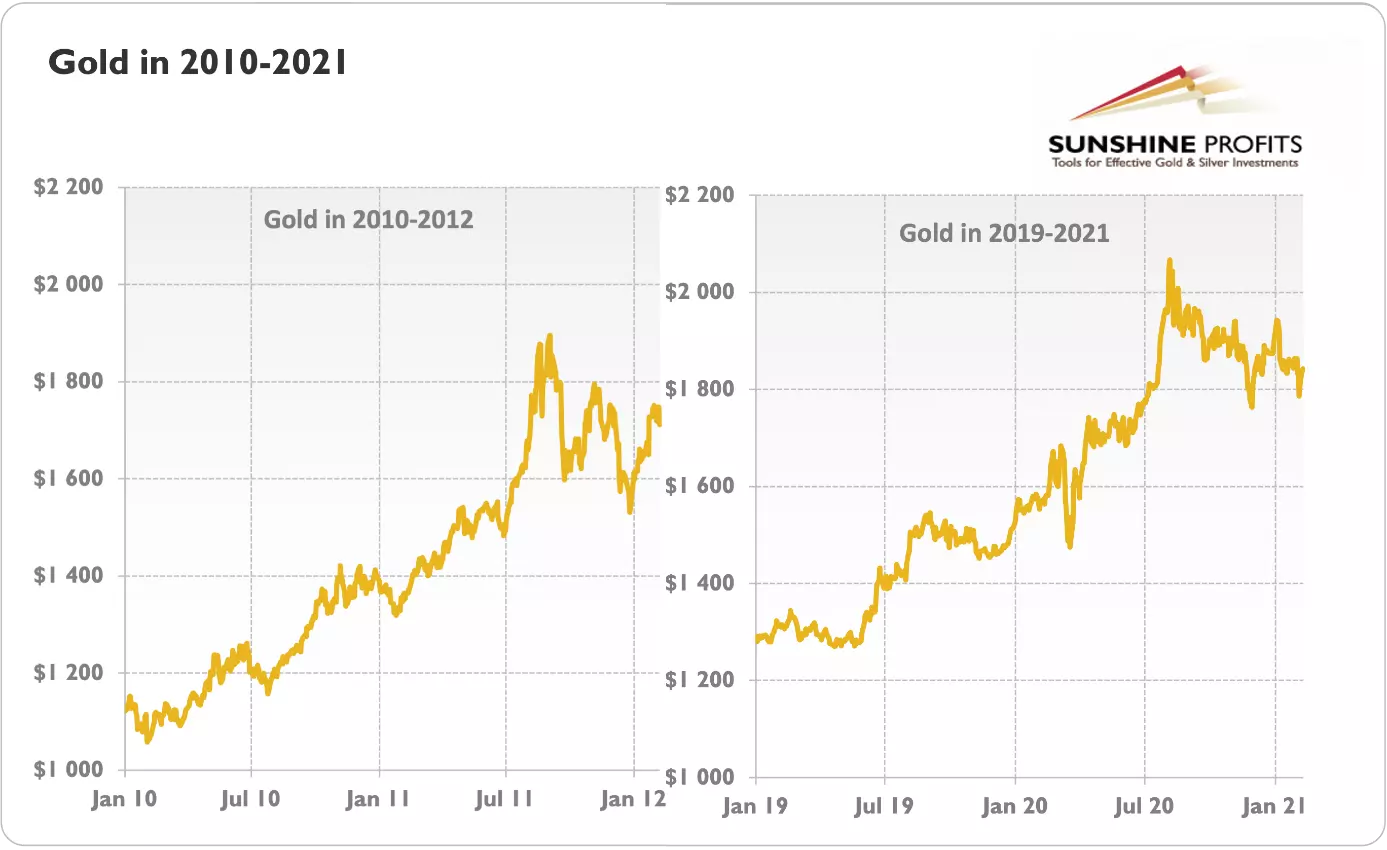
Is gold now replaying 2010-2012?
The 2019-2021 gold chart is disturbingly similar to that of 2010-2012, but it does not have to be the harbinger of a bear market.
Many ancient cultures saw history as cyclical. According to this view, society passes through repeated cycles. Can this apply to gold as well? I’m not referring here to the simple fact that we have both bull and bear markets in the precious metals –” I refer here to the observation that gold’s price pattern seen in 2019-2021 mirrors that of 2010-2012. Please take a look at the chart below.
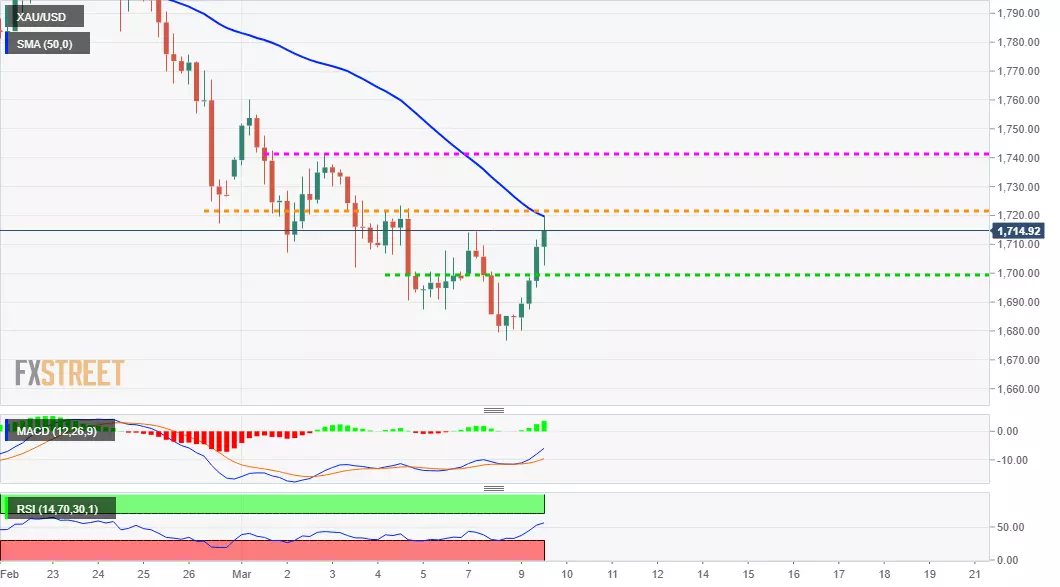
Gold Price Analysis: XAU/USD jumps to three-day tops, around $1720 level
Gold built on its goodish intraday positive move and climbed to three-day tops, around the $1720 region during the early North American session.
A sharp pullback in the US Treasury bond yields turned out to be a key factor extending support to the non-yielding yellow metal. Retreating US bond yields prompted some US dollar profit-taking, which, in turn, provided an additional boost to the dollar-denominated commodity.
From a technical perspective, oversold RSI on the daily chart remained supportive of the short-covering bounce. Moreover, oscillators on hourly charts have been gaining some positive traction and support prospects for further recovery from nine-month lows touched on Monday.


