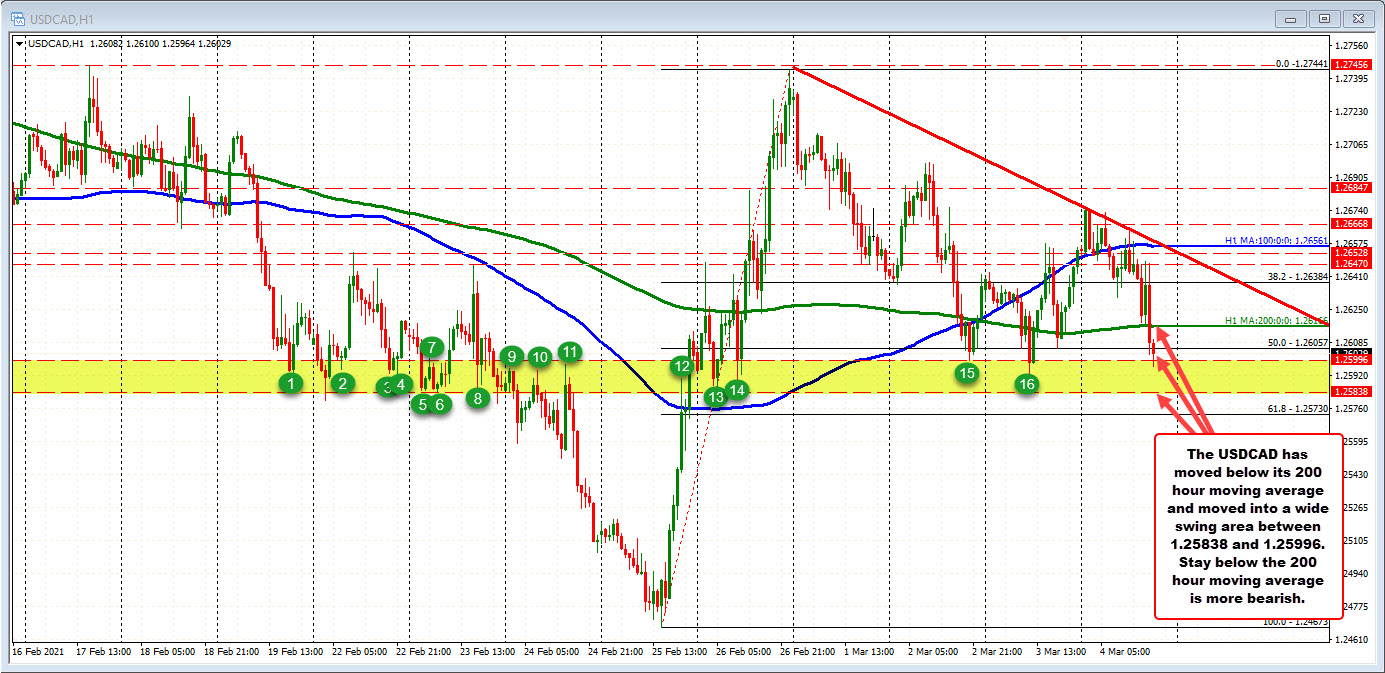
The MA was tested earlier but has now broken the MA level
The USDCAD has broken below its 200 hour moving average 1.26166. Earlier in the session, the pair’s price came down and tested the moving average line (see green line), only to find willing buyers.
The corrective move back higher took the price toward a swing area between 1.2647 and 1.26528, but found sellers (it was ahead of the 100 hour moving average at 1.26561 as well).
The subsequent fall has now seen the 200 hour moving average broken. The pair has reached a low of 1.25964. That love reached a wide swing area where a number of swing lows and highs have occurred going back to February 19 (see green numbered circles). The swing area comes between 1.25838 and 1.25996. The low price from Tuesday and Wednesday also bottomed area. Moving below is needed to increase the bearish bias.
Nevertheless, with the pair initially finding support against the 200 hour moving average earlier today, that moving average now represents resistance. Stay below keeps the bears more in control. Move above and the waters get muddy on the failed break. On the downside, getting below 1.25838, should open the doors for further downside momentum.
