- Silver extends losses from a fortnight top marked the previous day.
- Receding strength of bullish MACD signals, downward sloping RSI favor sellers.
- A 2.5-month-old support line challenges bear below the short-term key support line.
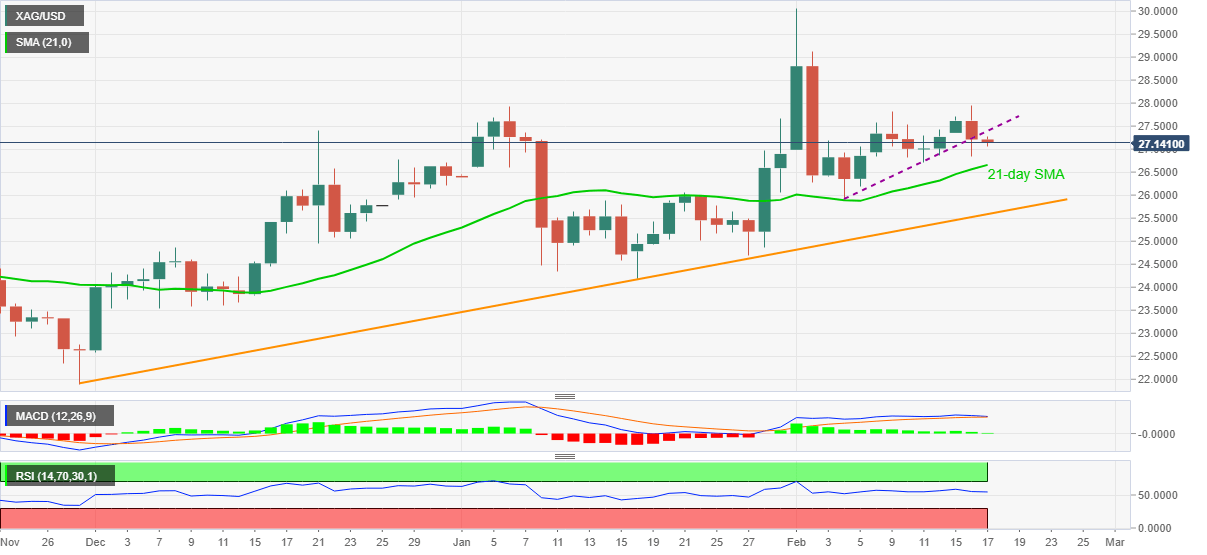
Silver prices remain depressed around $27.12, down 0.24%, despite recently bouncing off an intraday low of $27.05. The reason could be traced from the metal’s downside break of an ascending support line, now resistance, stretched from February 04.
Also favoring the bullion sellers could be the latest reduction in the MACD’s bullish signals and descending RSI line.
That said, the commodity prices currently drop towards a 21-day SMA level of $26.65, a break of which will highlight an ascending support line from November 30, at $25.60.
Although silver is likely to stay beyond the stated support, unless any drastic fundamental change, a clear downside break of $25.60 will not hesitate to refresh the yearly low of $24.18 marked the previous month.
On the flip side, an upside break above the previous support, at $27.40 now, will eye for the $28.00 and the $29.00 thresholds during the run-up to the monthly peak surrounding $30.05.
To sum up, silver is likely to extend the latest weakness but a trend change is yet to be confirmed.
Silver daily chart
Trend: Bullish

