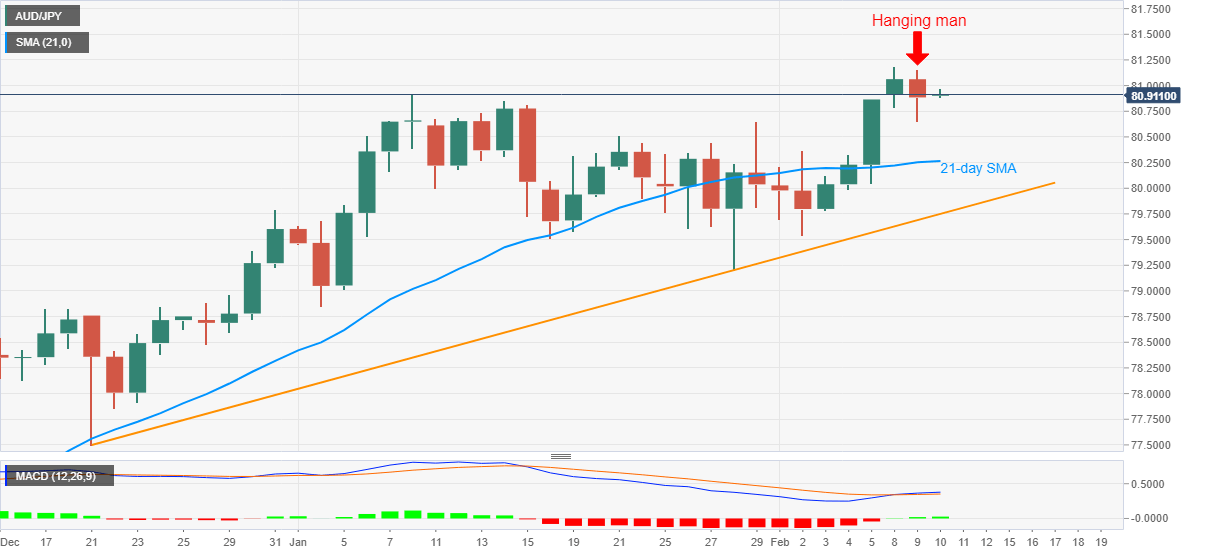
- AUD/JPY fades bounce off 80.64, snapped five-day uptrend on Tuesday.
- Bearish candlestick formation gains major attention near the highest since December 2018.
- Bullish MACD, multiple tops in January will test intraday sellers.
AUD/JPY drops to 80.91 during the early Wednesday’s Asian session. In doing so, the cross justifies the previous day’s hanging man candlestick formation on the daily (D1) chart.
With the bearish candlestick on the multi-day top, AUD/JPY is likely to extend its latest pullback from 81.19. However, bullish MACD and multiple stops marked during January, also including 21-day SMA challenges the quote’s short-term downside.
The late January top near 80.65 could be the immediate support to watch ahead of the 21-day SMA level of 80.26.
Also likely to test the AUD/JPY bears is the 80.00 round-figure and an ascending trend line from December 21, 2020, currently around 79.75.
Meanwhile, an upside clearance of Monday’s top of 81.19 will initially eye for the 82.00 round-figure ahead of targeting the December 13, 2018 high near 82.20.
AUD/JPY daily chart
Trend: Pullback expected


 This “NEW CONCEPT” Trading Strategy Prints Money!… (INSANE Results!)
