Flows into back into EUR today.
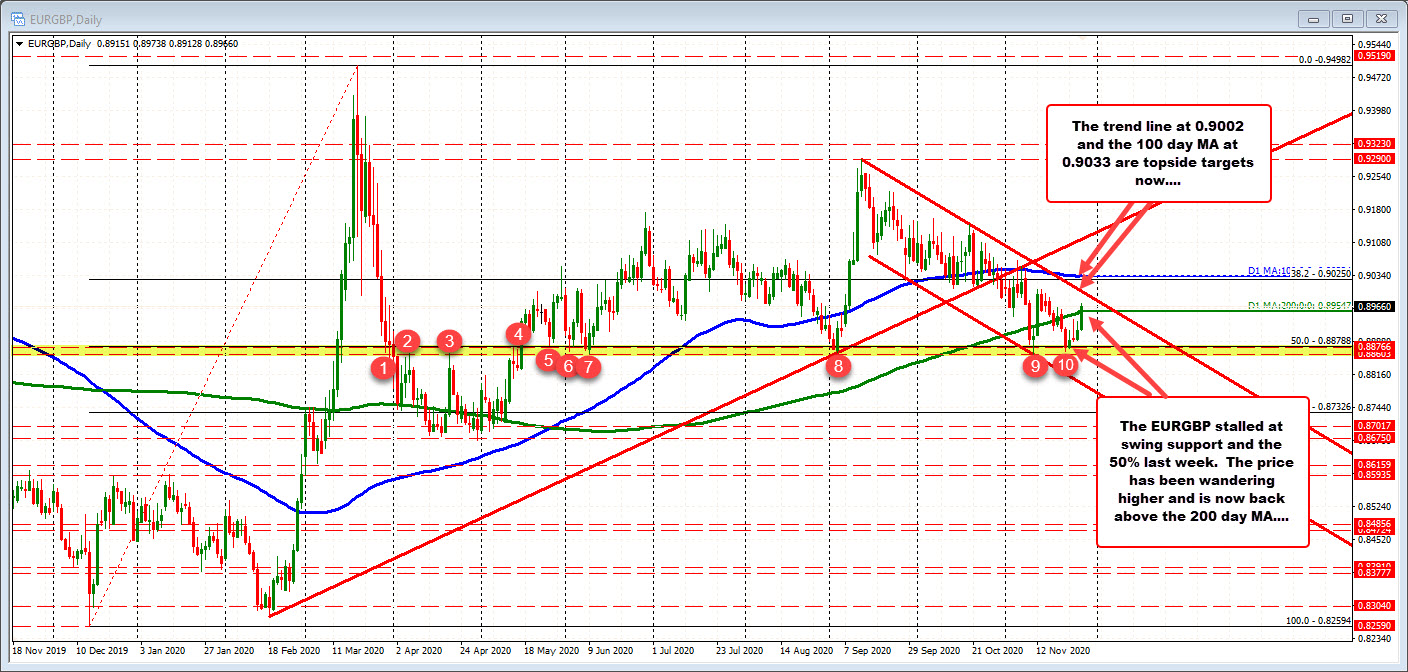
The EURGBP has moved back above its 200 day MA at 0.89547 (green line in the chart below). The pair has been wandering higher over the last 4 days after bottoming in the 0.8860 to 0.88798 swing area and the 50% of the range since December 2018 low at 0.88788. That floor held support back on November 11 and again on November 23rd.
Drilling to the hourly chart below, the price moved above the 200 day MA (at 0.89547) and a topside channel trend line and swing high at 0.89626. Stay above each, keeps the buyers in firm control. Move back below each and the buyers start to relinquish control back to the sellers.
This article was originally published by Forexlive.com. Read the original article here.