- GBP/USD seesaws around short-term key resistance line after refreshing two-month high.
- Upbeat RSI conditions keep buyers hopeful above 200-bar SMA.
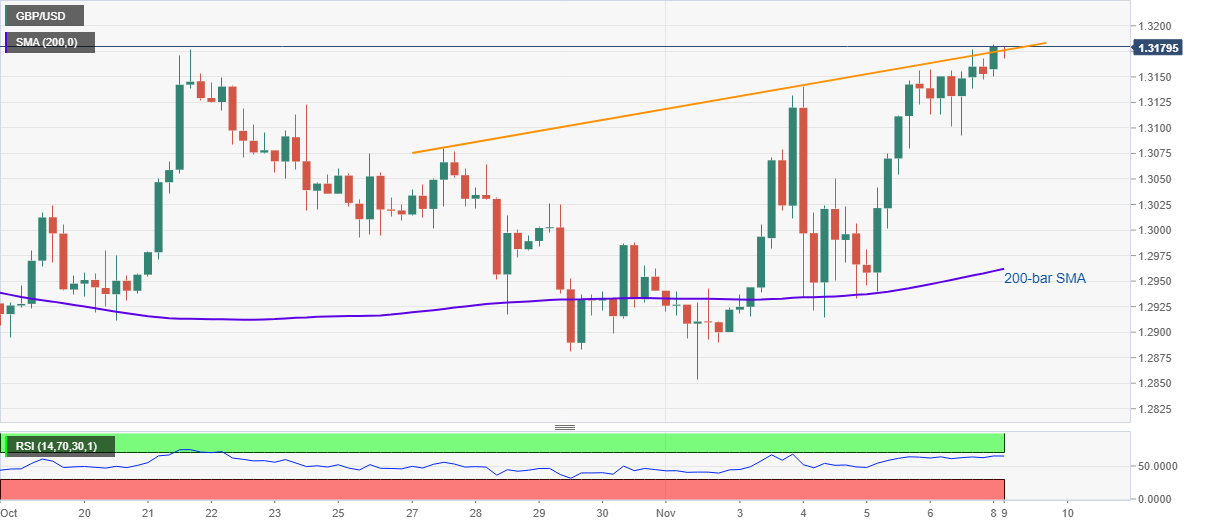
GBP/USD stays positive around 1.3175, up 0.15% intraday, during Monday’s Asian session. The early Asian up-tick to 1.3182 extended the pair’s run-up to the fresh high since September 07 amid the price-positive RSI conditions.
Even so, a clear break beyond an ascending trend line from October 27, currently around 1.3175/80 becomes necessary for the GBP/USD bulls to aim for the 1.3200 threshold.
During the quote’s further upside past-1.3200, the August 19 high near 1.3270 can offer an intermediate halt to the north-run towards September’s peak surrounding 1.3485.
On the flip side, the 1.3100 round-figure and last Wednesday’s high of 1.3050 can restrict the pair’s pullback moves before directing the GBP/USD sellers toward a 200-bar SMA level of 1.2962.
Should there be a clear downside past-1.2962, the monthly low near 1.2855 can return to the charts.
GBP/USD four-hour chart
Trend: Bullish

