- GBPUSD eases from 1.252, the highest since early-March, towards 1.2900.
- Overbought RSI conditions, resistance line of a bullish chart pattern favor the Cable’s further weakness.
- 200-bar SMA adds to the support, 1.3000 becomes the key for the further upside.
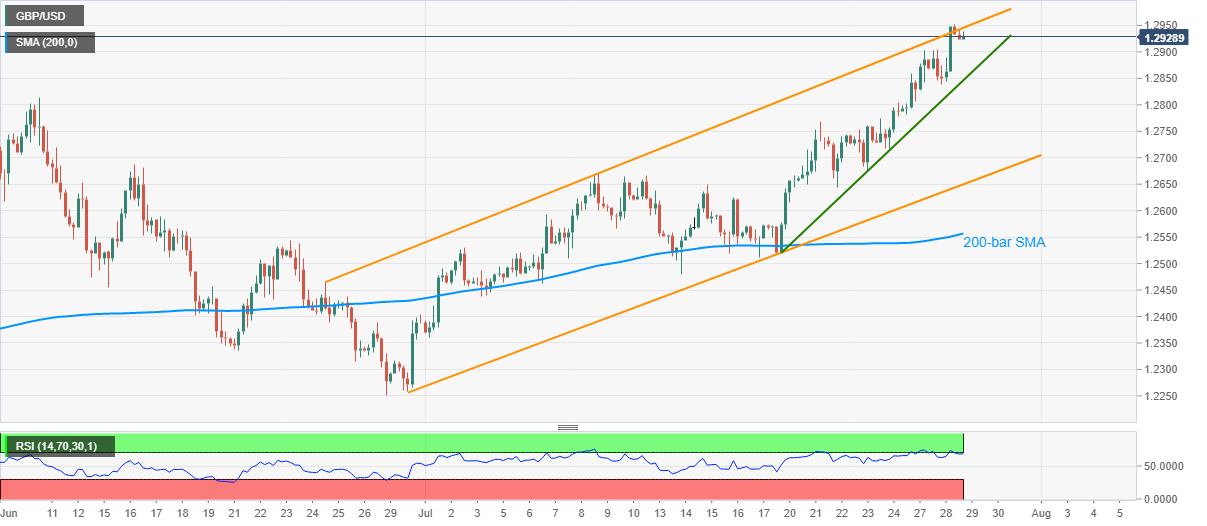
GBP/USD recedes to 1.2925 during Wednesday’s Asian session. The pair refreshed the highest since March 13 the previous day but the upper line of an ascending trend channel from June 25 tamed the quote’s further upside amid overbought RSI conditions.
Considering this, the sellers are currently targeting the weekly support line, near 1.2850/45, as immediate rest ahead of revisiting July 21 top near 1.2770 and the mid-June top close to 1.2690.
If at all the bears remain dominant past-1.2690, support line of the said channel and 200-bar SMA, respectively around 1.2650 and 1.2555, become the key for the pair traders to watch.
On the upside, a sustained rise beyond the latest high near 1.2950 will need a clear break of 1.3000 threshold to aim for February 13 high of 1.3069 and March 2020 peak close to 1.3200.
GBP/USD four-hour chart
Trend: Further weakness expected