Forex news for near trading on July 24, 2020
In other markets:
- Spot Gold rose above the $1900 level for the 1st time since September 2011 and move closer to the all-time high price from the same calendar month at $1921. The precious metal is trading at $1901.58 that’s up $14.14 or 0.75%. The high price reached $1906.58. The low price extended to $1881.91
- spot silver which had a huge week to the upside rose by 14.8 cents or 0.66% to $22.73. It’s high price reached $22.92. The low price extended to $22.41
In the US stock market today the major indices fell. Intel earnings and delays in its chip manufacturing sent its shares down sharply. Intel close today $-9.81 or -16.24% at $50.59. The final numbers for the day show the NASDAQ down -0.94% the S&P down -0.62% and the Dow industrial average down -0.68%. For the week, the NASDAQ closed down for the 2nd consecutive week by -1.33%. The Dow industrial average fell by -0.76% while the S&P index fell by -0.28%.
In the US debt market yields were little changed across the board:
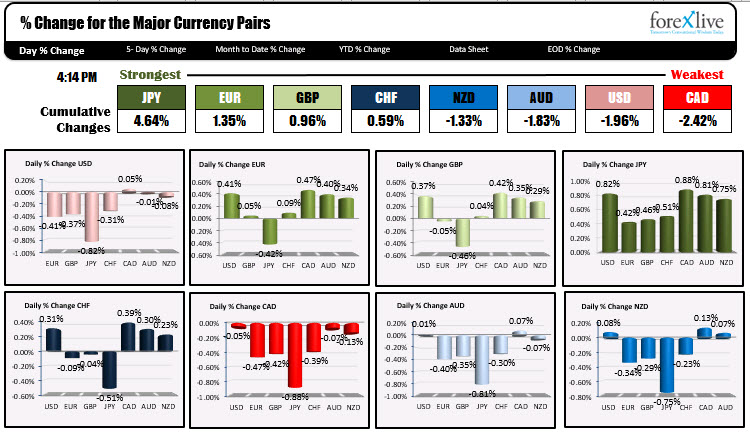
In the forex, the Canadian dollar and US dollar led the way to the downside. Most of the declines were against the JPY, EUR, GBP and CHF.

The EURUSD trade to the highest level since September 2018, and in the process moved above the midpoint of the trading range since the February 2018 high. That level comes in at 1.15958. In the new trading week ahead, if the price stays above that level, the bulls will have firm control. The Next major target comes in at the September 2018 high price of 1.1814. That is near the 61.8% retracement 1.1822.
The GBPUSD it’s low on Monday at 1.2517 and closed near its week high at 1.28028. The pair moved to the highest level since June 10 when the price peaked at 1.28118. That will be the next upside target in the new trading week. Close risk on Monday will be the Tuesday and early Friday highs at the 1.2766 – 72 area. Move back below that level and there could be further probing to the downside. However it will take a move below the rising 100 hour moving average at 1.272242 hurt the bullish bias seen in the pair this week.
The USDJPY USDJPY was mired in an 85 pip range coming into Thursday’s trade and was stuck in a 16 pip trading range in the New York session on Thursday. Then sellers of the dollar took over and the price trended from a high of 107.224 to a low today of 105.672. Today the price fell below the May and June lows at the 105.97 to 106.06 area. We are trading between those levels into the close for the week. Needless to say that area will be the barometer for the buyers and sellers in early next week’s trading. Stay below 105.978 and the sellers will be in control. Move above 106.06 and we could see further upside corrective move higher.
The USDCHF was a another pair that trended to the downside in trading this week. The current price is trading at 0.9218. That is right around the low lowest closing price going back to February 2018. On further downside in early trading next week will have traders looking toward the low from 2018 at 0.9185 and the low from 2020 at 0.91747. Break below those levels and the pair is trading at the lowest level since mid year 2015
The USDCAD corrected some of the declines seen in the 1st 4 trading days of the week on Friday. However the high price still stay below the falling 100 hour moving average at 1.34366. It will take a move back above that falling moving average to tilt the bias more to the upside in the new trading week. Until then sellers still remain more in control. The low for the week reach 1.33506. That was the lowest level going back to June 2020 where the low extended to 1.33144.
The NZDUSD trade above and below its 100 hour moving average on Friday as traders debated which way to go. The low today stalled right around the 30.2% retracement of the move up from the July 14 low at 0.66177, but rebounded back above the 100 hour moving average into the close. That moving average currently comes in at 0.6634. In the new trading week getting below the 100 hour moving average and staying below AND falling below the 30.2% retracement at 0.66177 would be needed to tilt the bias more to the downside.
The AUDUSD is another currency pair which is hanging around its 100 hour moving average. For the pair, its 100 hour moving average currently comes in at 0.7104. The price is just below that level at 0.71015. Into the new week, the 100 hour moving average will be the barometer for the bulls and bears. Move above and the biases more to the upside. Move below in control is in the hands of the shorts.
Remember to sign up for the traders Summit on Tuesday. I know this weekend will be working on my presentation. Hope to see you all there on Tuesday.

