- Silver prices recede after crossing the October 2013 peak with a high of $23.26.
- Confirmation of a bearish chart pattern will recall the sub-$22.00 area.
- Bulls will have to cross September 2013 top to extend the north-run.
Silver prices mark depression around $22.88 during the initial Asian trading on Thursday. The white metal surged to the highest since September 2013 before an hour but upside momentum fizzled afterward. Hence, a short-term rising wedge formation appears on the 30-minute chart, which in turn keeps the sellers hopeful near the multi-year high.
Though the bears will have to wait for a clear downside break past-$22.70 to confirm the commodity’s further weakness. Following that, the late-Wednesday low near $21.38 will be in the spotlight.
In a case where the quote remains weak below $21.38, $21.00 and 200-bar SMA level of $20.42 can act as buffers before highlighting the $20.00 threshold as the key support.
Alternatively, $23.00 could question the metal’s immediate upside ahead of the recent high and bearish pattern’s resistance line near $23.25.
It should, however, be noted that the quote’s rise past-$23.25 will have to pass through September 2013 peak surrounding $23.42 to attack $24.00.
Silver 30-minute chart
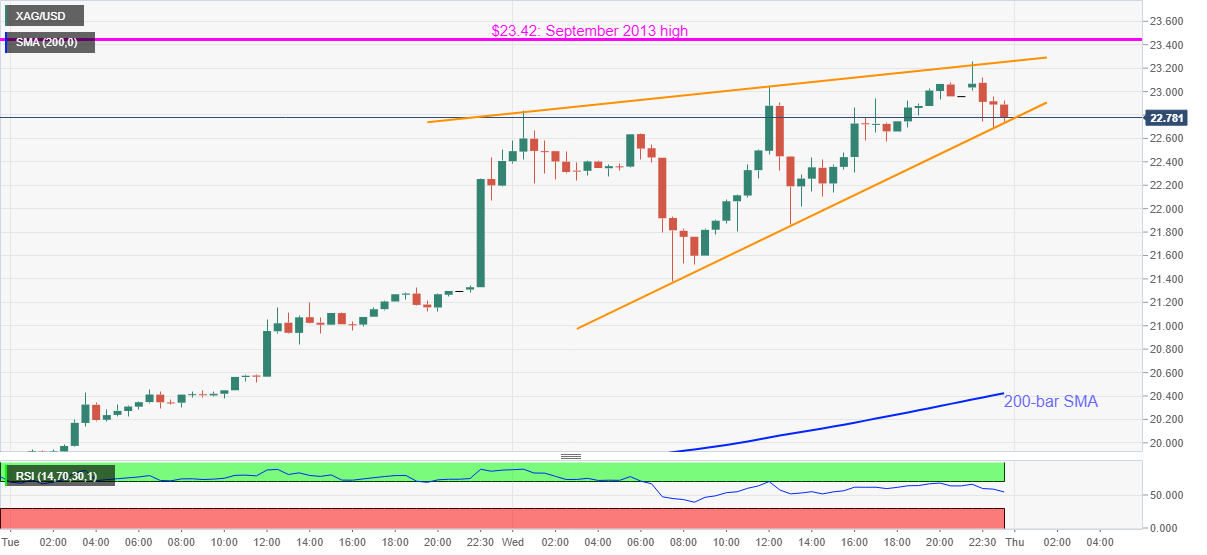
Trend: Pullback expected