Fundamental
Overview
The Nasdaq extended the
selloff yesterday following fresh Trump’s tariffs threats and especially additional 10%
tariffs on China. The market has been under pressure ever since last Friday
when we got the weak US Flash Services PMI and later the jump to a new 30-year
high in long term inflation expectations in the Final UMich Consumer Sentiment
survey.
The bulk of the selloff
came after the jump in the long-term inflation expectations though. The market
might be fearing that in case we get a slowdown, the Fed might not be fast
enough in cutting rates amid inflation remaining above target and uncomfortably
high long-term inflation expectations. Trump’s tariffs threats add to
expectations of a slowdown in growth.
March will be a great month
for traders because we will probably have the most important NFP and CPI
reports of the year ahead of the March FOMC decision where we will also get the
updated SEP and Dot Plot. The markets will need benign data on the employment
front coupled with easing inflationary pressures to trigger a rally.
Conversely, bad data coupled with higher inflationary pressures might even lead
to a new bear market.
Nasdaq
Technical Analysis – Daily Timeframe
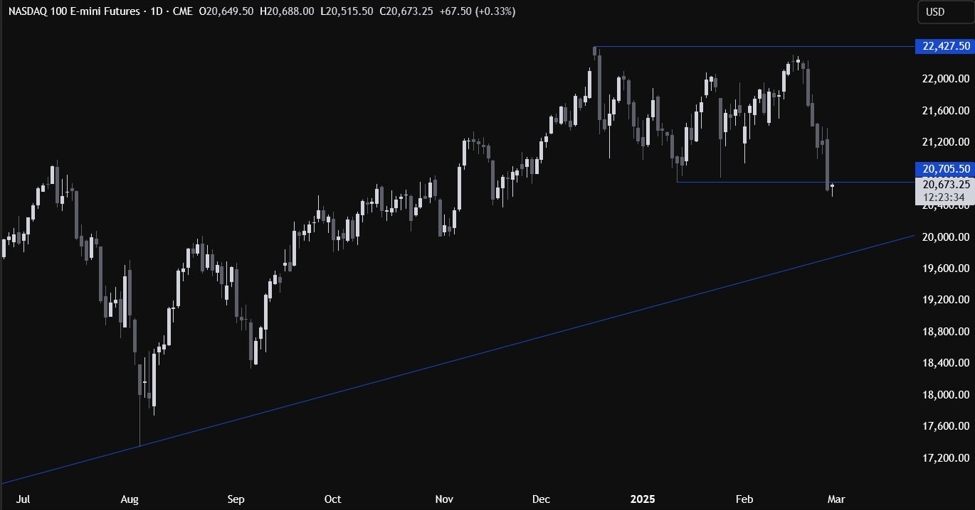
Nasdaq Daily
On the daily chart, we can
see that the Nasdaq dropped below the lowest price of the range that we had
since December. The sellers might increase the bearish bets to extend the
selloff into the major trendline. The buyers, on the other hand,
will want to see the price rising back above the 20705 level to start piling in
for a rally into the all-time highs.
Nasdaq Technical
Analysis – 4 hour Timeframe
Nasdaq 4 hour
On the 4 hour chart, we can
see that we have a downward trendline defining the bearish momentum. If the
price pulls back into it, we can expect the sellers to lean on the trendline to
position for another selloff into the major trendline. The buyers, on the other
hand, will look for a break higher to gain more conviction and increase the
bullish bets into a new all-time high.
Nasdaq Technical
Analysis – 1 hour Timeframe
Nasdaq 1 hour
On the 1 hour chart, there’s
not much we can add here as the sellers will likely pile in here with a defined
risk above the 20705 level, while the buyers will look for a break higher to
start targeting the downward trendline. The red lines define the average daily range for today.
Upcoming Catalysts
Today we conclude the week with the US PCE
data.
