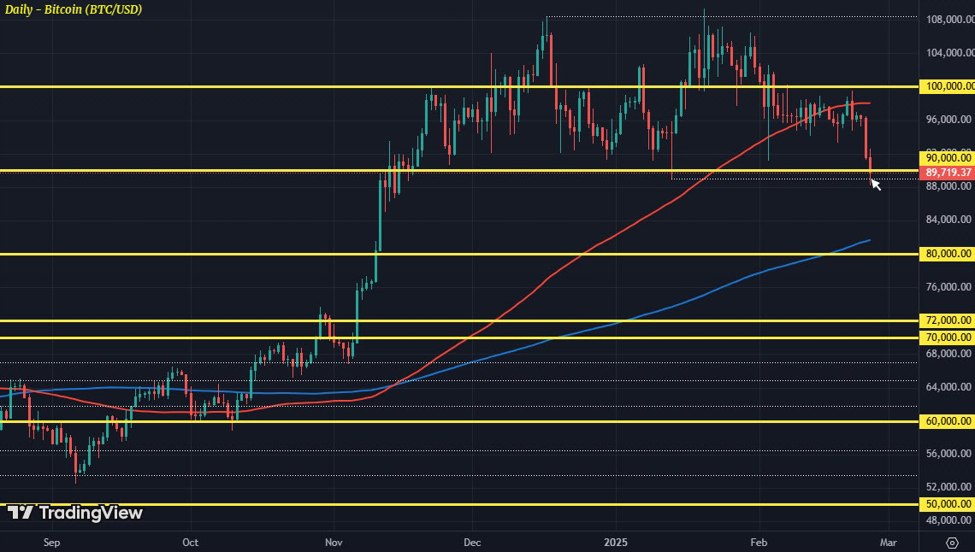
Bitcoin (BTC/USD) daily chart
It’s been a rough week so far for cryptocurrencies with some heavy selling in the last two days. Bitcoin itself is down 7% during this period, now testing waters under $90,000 again. It’s only the second time in three months that price is threatening to drop below the figure level but the technicals are potentially ominous as seen above.
Bitcoin is now holding on to the January low of $89,028 but a firm break under that could really set off more selling momentum. And that won’t be pretty for the broader mood in the crypto space.
I want to say that the latest selloff has in part to do with the whole ByBit fiasco. Hackers? Rug pull? It’ll be one up for debate for a long while. And by long while, it usually just means a week or so in the social media echo chamber.
The most impacted household name by that is Ethereum, which is down roughly 15% this week.
Ethereum (ETH/USD) weekly chart
That is seeing price dip to around $2,400 levels currently and as seen above, is threatening a break of its key weekly moving averages. From a technical perspective, it’s not a good sign especially when those levels are what helped to arrest previous drops since August last year.
The silver lining for dip buyers though is that there is still the key trendline support (white line) stretching from July 2022 that is holding. So, that is also one to watch for the technical traders out there.