The price of bitcoin has reached a low of $96782 and bounced modestly. The digital currency currently traders at $98434 down -$1739 or -1.71% on the day.
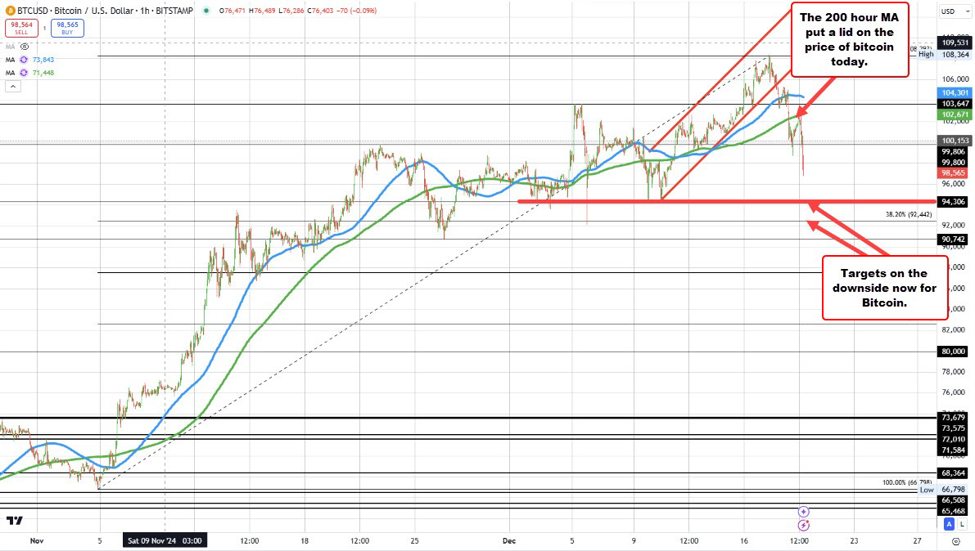
Looking at the hourly chart, the price moved below the 100 and 200 hour MAs yesterday and then corrected higher, reaching the 200 hour MA (green line on the chart above). Sellers leaned against the level and pushed lower. The 200 hour MA comes in at $102.670. Staying below it will keep the sellers in control technically at least in the short and medium term.
The next downside target comes in at $94306 and below that the 38.2% of the move up from the November low. That level comes in at $92,442.
This article was originally published by Forexlive.com. Read the original article here.