Fundamental
Overview
The Russell 2000 has been underperforming
the other major indices recently and failed to extend into new highs. The
conditions for a strong rally into new all-time highs remain in place though.
In fact, Trump’s policies will
be a positive driver for growth in 2025 and with the Fed remaining in an easing
cycle, growth should remain positive and might even accelerate as signalled
already by the Atlanta Fed GDPNow
indicator.
The only bearish reason we
had for the stock market was the rise in Treasury yields in the past couple of
months. That’s generally bearish only when the Fed is tightening policy though
not when yields rise on positive growth expectations.
Right now, the Fed’s
reaction function is that a strong economy would warrant an earlier pause in
the easing cycle and not a tightening. That should still be supportive for the
stock market.
If the Fed’s reaction
function were to change to a potential tightening, then that will likely
trigger a big correction in the stock market on expected economic slowdown. For
now, the pullbacks look as something healthy and opportunities to buy the dips.
Russell 2000
Technical Analysis – Daily Timeframe
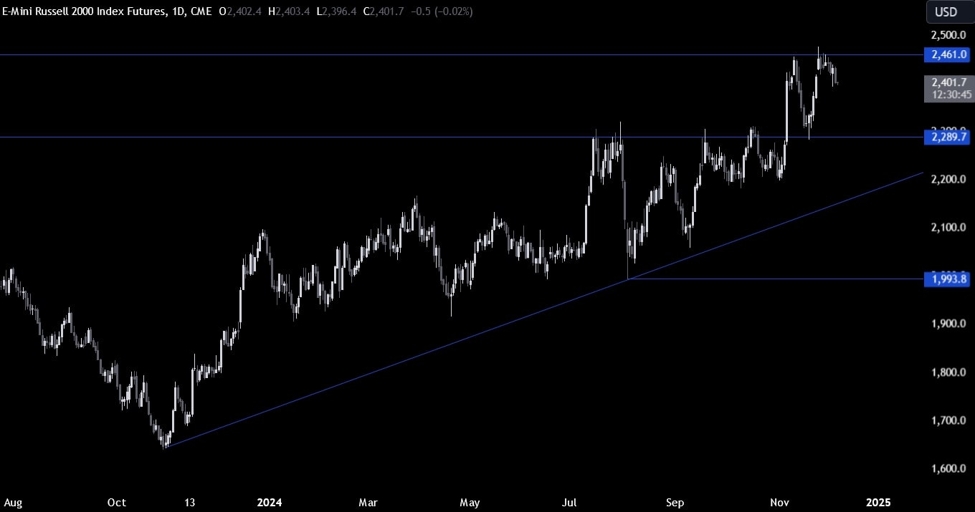
Russell 2000 Daily
On the daily chart, we can
see that the Russell 2000 failed to break into a new all-time high and pulled
back. The buyers will need to see the price breaking higher to increase the
bullish bets into new highs. The sellers, on the other hand, will keep on stepping
in around the recent highs to position for a drop back into the 2290 support.
Russell 2000 Technical
Analysis – 4 hour Timeframe
Russell 2000 4 hour
On the 4 hour chart, we can
see that we have a minor downward trendline
defining the current pullback. This might turn into a bull
flag if the price were to break above the trendline. That’s when we can
expect the bullish momentum to pick up as the buyers will likely pile in more
aggressively. The sellers, on the other hand, will likely lean on the trendline
to position for the drop into the 2290 support.
Russell 2000 Technical
Analysis – 1 hour Timeframe
Russell 2000 1 hour
On the 1 hour chart, we can
see that we have a strong support
turned resistance around the 2420 level. If the price gets there’s the sellers
will likely step in with a defined risk above the resistance to position for
the drop into the 2920 support. The buyers, on the other hand, will look for a
break higher to start targeting new highs. The red lines define the average daily range for today.
Upcoming
Catalysts
Today we conclude the week with the US NFP report.
