Fundamental
Overview
We continue to see a
pullback in the US Dollar as the market kind of reached the peak in the
repricing of interest rates expectations and it will need stronger reasons to
price out the remaining rate cuts for 2025.
This was signalled by the
lack of US Dollar strength after lots of strong US data with the market’s
pricing remaining largely unchanged around three rate cuts by the end of 2025.
We might see the greenback remaining on the backfoot at least until the US CPI
due in two weeks.
On the NZD side, the RBNZ
this week cut interest rates by 50 bps as expected but overall was less dovish
than the market’s aggressive view. Right now, the market sees a 68% chance of a
25 bps cut in February 2025 and a total of 88 bps of easing by the end of next
year.
NZDUSD
Technical Analysis – Daily Timeframe
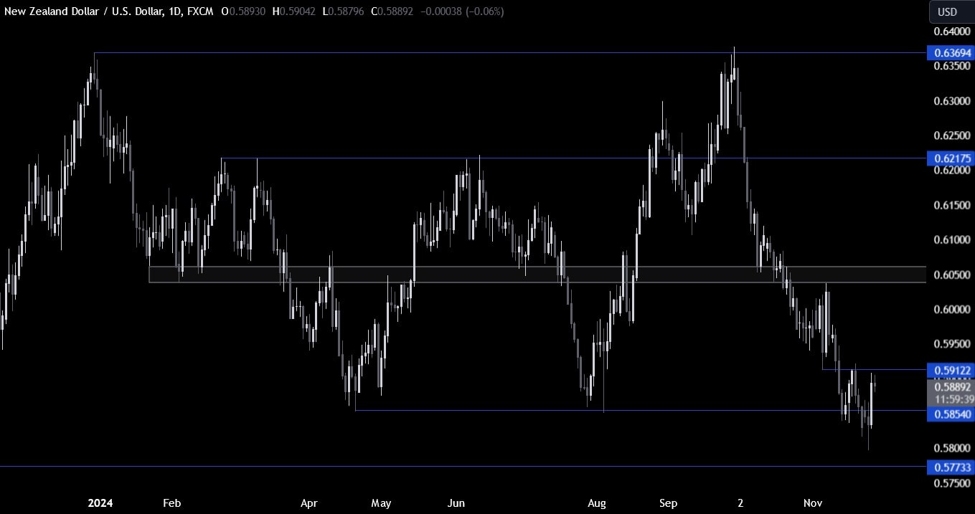
NZDUSD Daily
On the daily chart, we can
see that NZDUSD probed below the key support zone around the 0.5850 level but eventually
rallied back above it. We are now approaching a key resistance around the
0.5912 level.
This is where we can expect
the sellers to step in with a defined risk above the resistance to position for
a drop into new lows. The buyers, on the other hand, will want to see the price
breaking higher to increase the bullish bets into new highs.
NZDUSD Technical
Analysis – 4 hour Timeframe
NZDUSD 4 hour
On the 4 hour chart, we can
see that we have also the 50% Fibonacci
retracement level standing around the 0.5912 resistance. This should
technically strengthen the resistance zone. Again, the sellers will look for a
rejection around the resistance, while the buyers will look for a break to the
upside to position for a rally into the 0.6050 level next.
NZDUSD Technical
Analysis – 1 hour Timeframe
NZDUSD 1 hour
On the 1 hour chart, we can
see that we have an upward trendline
defining the current pullback into the resistance. If we were to get a pullback
into it, we can expect the buyers to lean on it to position for a break above
the resistance, while the sellers will look for a break below it to increase
the bearish bets into new lows. The red lines define the average daily range for today.


 RULE-BASED Pocket Option Strategy That Actually Works | Live Trading
 This “NEW CONCEPT” Trading Strategy Prints Money!… (INSANE Results!)