, ETMarkets.com|

1/7
Market Roundup
Indian market remained volatile on Tuesday and pared most of the morning gains to close in the red. The S&P BSE Sensex fell more than 800 points while the Nifty50 closed below 23900.
Getty Images

2/7
Sectoral Watch
Sectorally, buying was seen in realty stocks while selling was visible in auto, capital goods, power and utilities.
Getty Images

3/7
Breakout Stocks
Stocks that were in focus include names like Fortis Healthcare, which was up more than 2%, and HCL Technologies which pared gains to close marginally in the red.
Triveni Turbines saw a massive volume spike as the stock closed with gains of over 3% on Tuesday.
ETMarkets.com

4/7
Analyst Call
We spoke to an analyst on how one should look at these stocks the next trading day entirely from an educational point of view:
Analyst: Priyanka Limaye, CA, CMT
ETMarkets.com

5/7
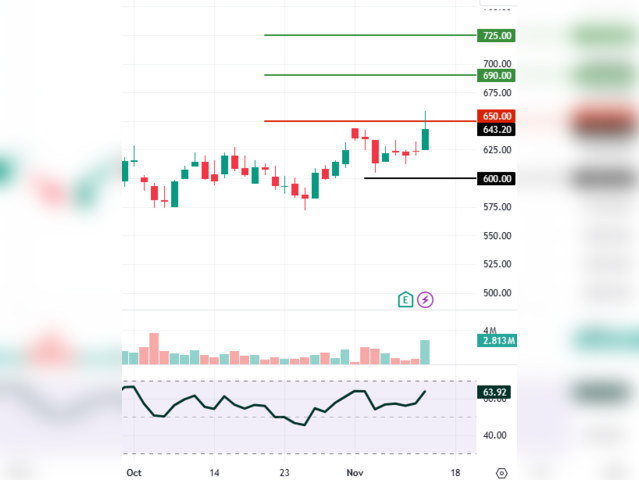
Fortis Healthcare: CMP 643
This stock has been steadily moving higher in a channel for the past 5-6 months. It is now at a crucial resistance level of 650.
If it is able to sustain this level successfully, we may see upper levels of 690 and 725 soon. Strong support stands at 600. The RSI is in the bullish zone, and volumes have been good in the last couple of days.
ETMarkets.com

6/7
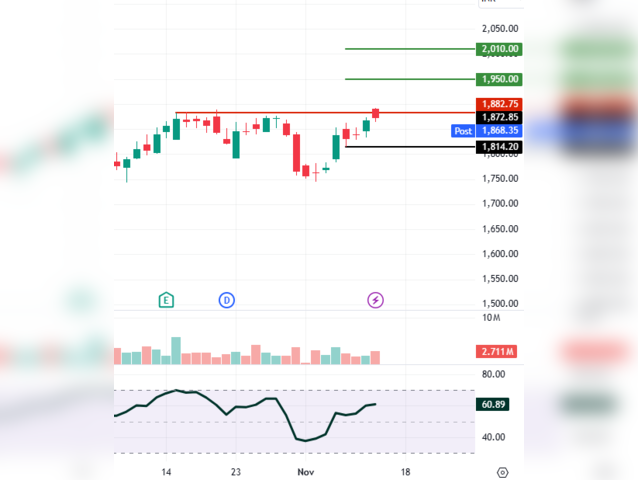
HCL Technologies: CMP 1,872
This stock has been consolidating for about a month now, and on Tuesday it has again tested its previous high of 1,888. The level of 1,882 is a strong hurdle.
If it sustains here, it can go up to 1,950 and 2,010 on the upside. Its immediate support stands near 1,814.
The RSI is in the bullish zone for now, but volumes need to pick up more for a good move to the upside.
ETMarkets.com

7/7
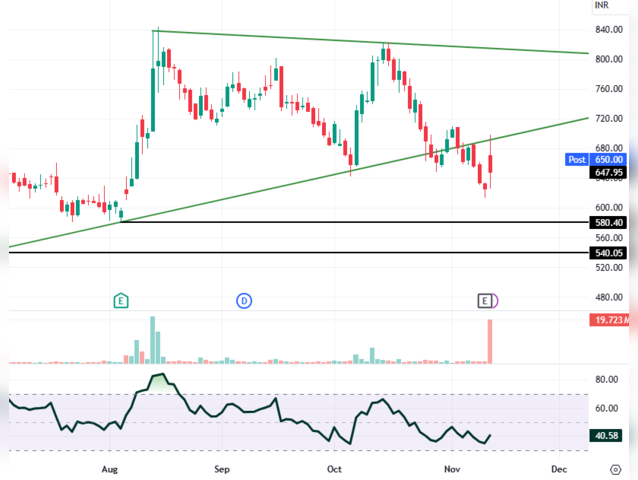
Triveni Turbines Ltd: CMP 647
This stock has been consolidating for 2 months and was moving in a triangle formation. It broke down from the formation last week.
Its downside levels stand at 580-540. The immediate resistance stands at 700. The RSI is in the bearish zone, and MACD is also giving a sell signal. Post Monday’s earnings, Tuesday’s volume has been quite huge.
(Disclaimer: Recommendations, suggestions, views, and opinions given by experts are their own. These do not represent the views of the Economic Times)
ETMarkets.com
