Fundamental
Overview
Bitcoin is now up almost
30% since the election day as the bullish momentum in the cryptocurrency
exploded following Trump’s victory. This shouldn’t be surprising given that
Trump vowed to make the US the crypto capital of the planet.
Moreover, it looks like the
US economy continues not only to do well but also re-accelerating amid the Fed’s
easing and the expectations of expansionary fiscal policies like tax cuts and
deregulation.
Bitcoin, alongside Dogecoin
and stocks like Tesla and Coinbase, have been the top beneficiaries of Trump’s
victory given their direct connection to Trump. For now, there’s no real top in
sight as we would likely need a contractionary monetary policy or a notable
slowdown in the economy.
The risk going forward is
the Fed. If the central bank starts to mention the need of more tightening,
then we could see some big corrections in all risk assets. That day though looks
to be at least a couple of months away for now.
Bitcoin
Technical Analysis – Daily Timeframe
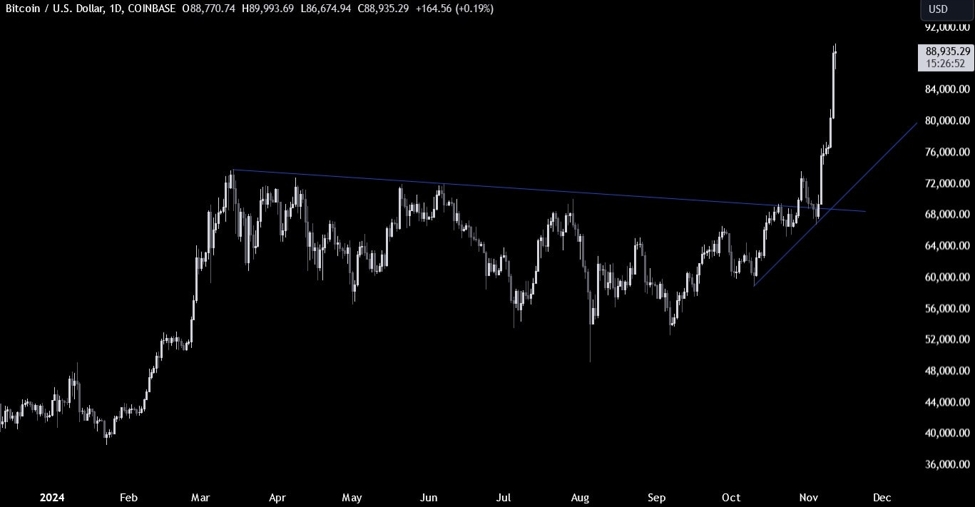
Bitcoin Daily
On the daily chart, we can
see that Bitcoin is now trading near the 90K level. The 100K level is the
natural target, something that has been talked about a lot. That doesn’t mean
it cannot go any higher than that though. For now, it’s a momentum play and
despite the obvious nervousness one can get seeing the euphoria in the air,
there’s no negative catalyst in sight that could reverse the trend.
Bitcoin Technical
Analysis – 4 hour Timeframe
Bitcoin 4 hour
On the 4 hour chart, we can
see that we have an upward trendline
defining the current bullish momentum. That’s now far away from the current
price and it’s unlikely that we will see a pullback into it in the near term
unless we get a very hot US CPI report tomorrow.
If we do get there though,
the buyers will likely lean on it to position for a rally into new highs, while
the sellers will look for a break lower to increase the bearish bets into the
next major trendline around the 75K level.
Bitcoin Technical
Analysis – 1 hour Timeframe
Bitcoin 1 hour
On the 1 hour chart, we can
see that we have another minor upward trendline defining the bullish momentum
on this timeframe. The buyers will likely keep on leaning on it to position for
further upside, while the sellers will look for a break lower to increase the
bearish bets into the next trendline.
More aggressive buyers, might pile in
already on the break of the recent high around the 90K level targeting the 100K
level. The red lines define the average daily range for today.
Upcoming
Catalysts
This week is a bit empty on the data front with the most important releases
scheduled for the latter part of the week. Tomorrow, we have the US CPI report.
On Thursday, we get the latest US Jobless Claims figures. On Friday, we
conclude the week with the US Retail Sales data.
